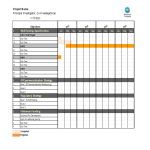
Project Risk Analysis
Save, fill-In The Blanks, Print, Done!

Download Project Risk Analysis
Adobe Acrobat (.pdf)- This Document Has Been Certified by a Professional
- 100% customizable
- This is a digital download (332.31 kB)
- Language: English
- We recommend downloading this file onto your computer.
Adequate communication is essential in order to finish projects successfully. In order to gain truthful and accurate information, you need to make sure that program- or project managers are able to make rational and correct decisions. For those who have, what we call, a "high-performance mindset”, we know they prefer to work with the latest update of professional project management templates, in order to achieve their goals faster. We are certain this Project Risk Analysis will be of value.
Feel free to download this Project Risk Analysis, or simply browse through our other basic or advanced template designs. They are intuitive and in several kinds of formats, such as PDF, WORD, XLS (EXCEL including formulas and can calculate sums automatically), etc.
Using this project management template guarantees that you will save time, cost and efforts and makes you more successful in your project, work and business!
Completing your Project Risk Analysis was never simpler! Download this project management template now!
As part of this investigation, you created 1 (adopted from Plous, 1993): Project deadline is missed Project was on schedule Subcontractor is involved in a project 8 times 2 times Subcontractor is not involved in a project 4 times 1 time Table 1 Example of covariation assessment A short glance of this table you may lead you to believe that your subcontractor is a major source of your problems the largest number of failures (eight) occurred when subcontractor was involved in the project.. Spider diagram The upper bars of a tornado diagram The line with the steepest slope on a spider diagram This type of sensitivity analysis is widely used in economic evaluations, where we have a quantitative economic model of the project.. How do you develop low, base, and high estimates for input variables Why, for example, did you select a low and high cost estimates as 80 and 120 of the base value In theory, these estimates should come from an analysis of the underling nature of the parameter.. Managers know that experienced workers will cost more, but they don’t want to admit that a more experienced team will most likely lower overall project costs as they tend to focus on a short term goals (reduced monthly payroll) rather than long-term results.. Task 1 fixed cost Task 2 variable cost Task 4 fixed cost -0.5 -0.25 0 0.25 0.50 0.75 1.0 Correlation Coefficent for Project Cost Figure 5..
DISCLAIMER
Nothing on this site shall be considered legal advice and no attorney-client relationship is established.
Leave a Reply. If you have any questions or remarks, feel free to post them below.
Related templates
Latest templates
Latest topics
- Excel Templates
Where do I find templates for Excel? How do I create a template in Excel? Check these editable and printable Excel Templates and download them directly! - GDPR Compliance Templates
What do you need to become GDPR compliant? Are you looking for useful GDPR document templates to make you compliant? All these compliance documents will be available to download instantly... - Google Docs Templates
How to create documents in Google Docs? We provide Google Docs compatible template and these are the reasons why it's useful to work with Google Docs... - IT Security Standards Kit
What are IT Security Standards? Check out our collection of this newly updated IT Security Kit Standard templates, including policies, controls, processes, checklists, procedures and other documents. - Letter Format
How to format a letter? Here is a brief overview of common letter formats and templates in USA and UK and get inspirited immediately!
cheese


