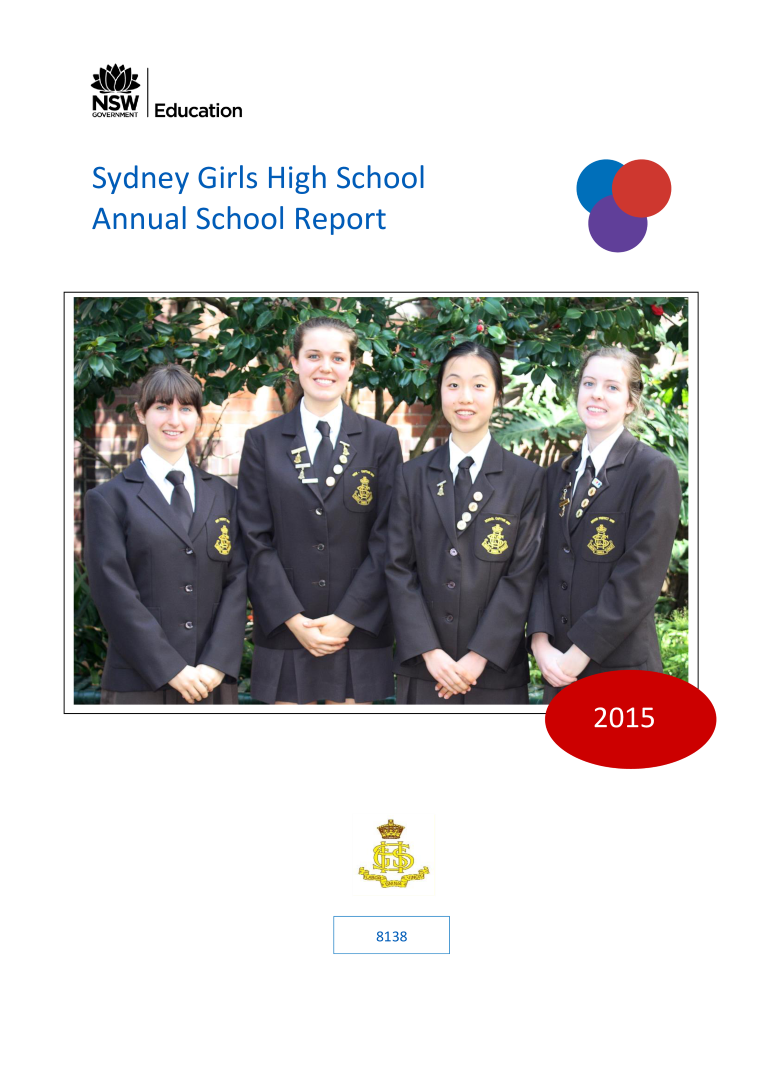
Annual School Report
Save, fill-In The Blanks, Print, Done!

Download Annual School Report
Adobe Acrobat (.pdf)- This Document Has Been Certified by a Professional
- 100% customizable
- This is a digital download (829.31 kB)
- Language: English
- We recommend downloading this file onto your computer.
How to draft a Annual School Report? An easy way to start completing your document is to download this Annual School Report template now!
Every day brings new projects, emails, documents, and task lists, and often it is not that different from the work you have done before. Many of our day-to-day tasks are similar to something we have done before. Don't reinvent the wheel every time you start to work on something new!
Instead, we provide this standardized Annual School Report template with text and formatting as a starting point to help professionalize the way you are working. Our private, business and legal document templates are regularly screened by professionals. If time or quality is of the essence, this ready-made template can help you to save time and to focus on the topics that really matter!
Using this document template guarantees you will save time, cost and efforts! It comes in Microsoft Office format, is ready to be tailored to your personal needs. Completing your document has never been easier!
Download this Annual School Report template now for your own benefit!
School 684.2 SSG 656.3 State DoE 538.9 Skill Band Distribution Band 4 5 6 7 8 9 Number in Band 0 0 0 2 29 118 Percentage in Bands School Average 2010-2015 0.0 0.0 0.0 0.0 0.0 0.0 1.3 1.7 19.5 22.3 79.2 76.0 SSG in Band 2015 0.3 1.1 1.8 7.3 26.7 62.9 State DoE in Band 2015 3.7 17.5 28.3 23.4 16.7 10.4 Note: paste ta graphs in Highlight graph Picture ( Metafile Year 7 NAPLAN Spelling Average score, 2015 School 692.9 SSG 661.6 State DoE 547.3 Skill Band Distribution Band 4 5 6 7 8 9 Number in Band 0 0 0 0 11 138 Percentage in Bands School Average 2010-2015 0.0 0.0 0.0 0.0 0.0 0.0 0.0 0.5 7.4 10.6 92.6 88.9 SSG in Band 2015 0.5 0.8 1.8 4.4 23.2 69.3 State DoE in Band 2015 8.7 9.8 19.5 25.6 25.0 11.4 Year 7 NAPLAN Writing Average score, 2015 School 636.8 SSG 598.5 State DoE 497.3 Skill Band Distribution Band 4 5 6 7 8 9 Number in Band 0 0 3 14 59 73 0.0 0.0 0.0 0.1 2.0 3.2 9.4 13.5 39.6 35.7 49.0 47.5 Percentage in Bands School Average 2011-2015 SSG in Band 2015 1.2 2.8 9.7 20.7 37.6 28.1 State DoE in Band 2015 14.6 24.7 26.8 18.4 11.6 3.8 Year 7 NAPLAN Grammar and Punctuation School SSG Average score, 2015 720.9 672.0 State DoE 535.0 Skill Band Distribution Band 4 5 6 7 8 9 Number in Band 0 0 0 0 6 143 Percentage in Bands 0.0 0.0 0.0 0.0 4.0 96.0 School Average 2010-2015 0.0 0.0 0.0 0.9 12.9 86.2 SSG in Band 2015 State DoE in Band 2015 0.7 10.3 0.9 13.3 2.2 28.8 4.2 20.6 16.2 15.6 75.8 14.4 NAPLAN Year 7 – Numeracy Year 9 NAPLAN Reading Average score, 2015 School 726.8 SSG 689.0 State DoE 573.1 Skill Band Distribution Band 5 6 7 8 9 10 Number in Band 0 0 0 3 34 112 Percentage in Bands School Average 2010-2015 0.0 0.0 0.0 0.0 0.0 0.0 2.0 5.2 22.8 34.0 75.2 60.8 SSG in Band 2015 0.5 0.9 2.6 9.4 34.9 51.7 State DoE in Band 2015 8.9 23.1 24.5 21.9 14.2 7.5 Year 7 NAPLAN Numeracy Average score, 2015 School 746.6 SSG 709.7 State DoE 540.4 Skill Band Distribution Band 4 5 6 7 8 9 Number in Band 0 0 0 0 0 149 Percentage in Bands 0.0 0.0 0.0 0.0 0.0 100.0 School Average 2010-
DISCLAIMER
Nothing on this site shall be considered legal advice and no attorney-client relationship is established.
Leave a Reply. If you have any questions or remarks, feel free to post them below.
Related templates
Latest templates
Latest topics
- Excel Templates
Where do I find templates for Excel? How do I create a template in Excel? Check these editable and printable Excel Templates and download them directly! - GDPR Compliance Templates
What do you need to become GDPR compliant? Are you looking for useful GDPR document templates to make you compliant? All these compliance documents will be available to download instantly... - Google Docs Templates
How to create documents in Google Docs? We provide Google Docs compatible template and these are the reasons why it's useful to work with Google Docs... - IT Security Standards Kit
What are IT Security Standards? Check out our collection of this newly updated IT Security Kit Standard templates, including policies, controls, processes, checklists, procedures and other documents. - Letter Format
How to format a letter? Here is a brief overview of common letter formats and templates in USA and UK and get inspirited immediately!
cheese

