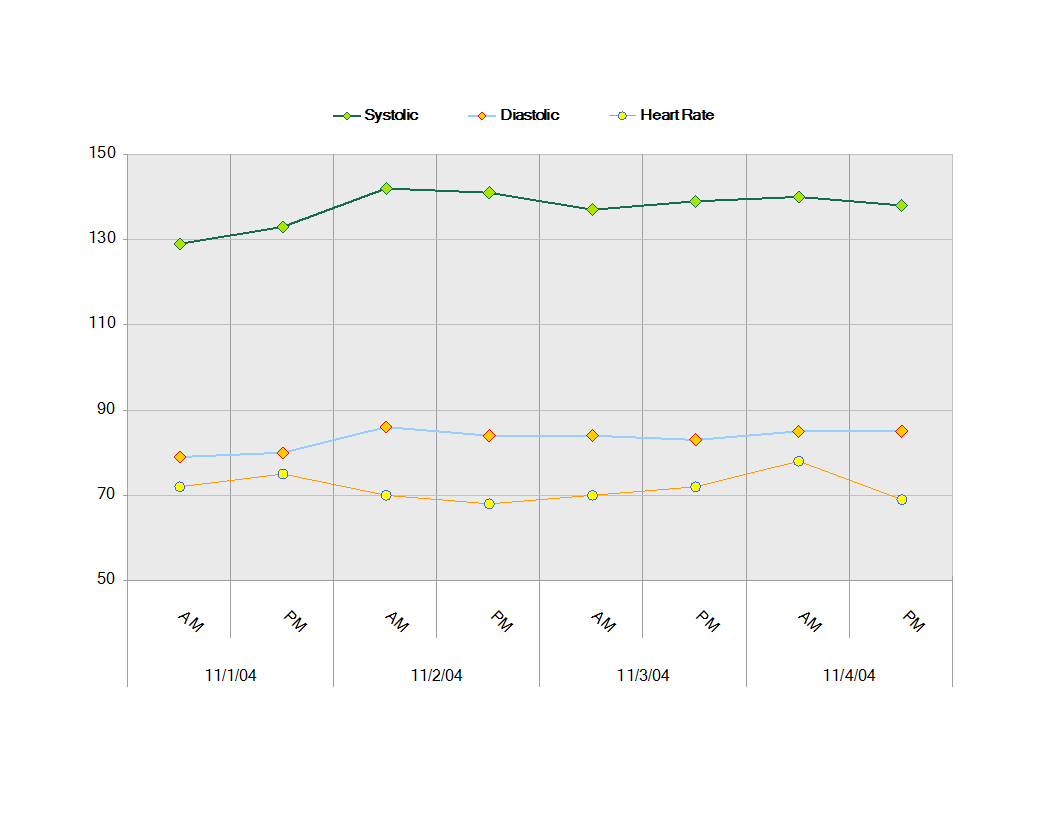
Blood Pressure Log Template excel worksheet
Save, fill-In The Blanks, Print, Done!

Download Blood Pressure Log Template excel worksheet
Microsoft Spreadsheet (.xlsx)- This Document Has Been Certified by a Professional
- 100% customizable
- This is a digital download (16.56 kB)
- Language: English
- We recommend downloading this file onto your computer.
How to graph blood pressure readings? How to create an overview in Google Sheets or Excel, like a Blood Pressure Log? Download this Blood Pressure Log Excel worksheet template that will perfectly suit your needs.
Graphing blood pressure readings can be a useful way to track and visualize changes over time. Here’s a guide on how to do it using Microsoft Excel:
Step-by-Step Guide to Graph Blood Pressure Readings
- Open Excel: Launch Microsoft Excel and open a new blank workbook.
- Enter Your Data:
- In the first column (A), enter the dates of the readings.
- In the second column (B), enter the systolic blood pressure readings.
- In the third column (C), enter the diastolic blood pressure readings.
A B C
Date Systolic Diastolic
01/01/2024 120 80
01/02/2024 125 82
01/03/2024 130 85
3. Select Your Data: Click and drag to select all the data, including the headers (A1
in the example). Insert a Line Chart:
4. Go to the "Insert" tab on the ribbon. Click on "Line Chart" in the Charts group. Select the type of line chart you prefer (e.g., 2D Line).
5. Format the Chart: Once the chart appears, you can format it to make it more readable and informative.
Click on the chart to select it. Use the "Chart Design" and "Format" tabs to customize the appearance (e.g., adding titles, changing colors, formatting axes).
6. Add Titles and Labels:
- Click on the chart title and type "Blood Pressure Readings".
- Click on the axis titles to label them (e.g., "Date" for the x-axis and "Blood Pressure (mm Hg)" for the y-axis).
- Right-click on one of the data series in the chart (systolic or diastolic).
- Choose "Format Data Series" to change the line color, style, or markers.
Repeat for the other data series.
- Save Your Work:
- Save your Excel workbook to keep the chart and data for future reference.
- Example of a Blood Pressure Graph
Generated Line Chart:
- The x-axis represents the dates.
- The y-axis represents the blood pressure values.
- Two lines on the chart, one for systolic (e.g., blue line) and one for diastolic (e.g., red line), show the changes over time.
Keeping a blood pressure log is crucial for maintaining and monitoring your cardiovascular health. Blood pressure is a key indicator of your overall health, and consistent tracking can provide valuable insights. Here are several reasons why maintaining a blood pressure log is important:
- Early Detection of Hypertension: Regularly recording your blood pressure can help detect hypertension (high blood pressure) early, allowing for timely intervention and treatment.
- Monitoring Treatment Effectiveness: For individuals already diagnosed with high blood pressure or other cardiovascular conditions, a blood pressure log helps assess the effectiveness of prescribed medications and lifestyle changes.
- Understanding Patterns and Triggers: By keeping a detailed log, you can identify patterns and triggers that affect your blood pressure, such as stress, diet, physical activity, and sleep. This understanding can guide you in making necessary lifestyle adjustments.
- Improved Communication with Healthcare Providers: A well-maintained blood pressure log provides your healthcare provider with accurate and comprehensive data, leading to more informed decisions regarding your treatment plan.
- Personal Accountability and Motivation: Regularly logging your blood pressure encourages personal accountability and can motivate you to adhere to a healthy lifestyle, including proper diet, regular exercise, and medication compliance.
The most important details are covered in this Blood Pressure Log template
- Name:
- Sex
- Age:
- Date
- time blood pressure
- systolic (upper number)
- diastolic (lower number)
This Blood Pressure Log Template excel worksheet is intuitive, ready-to-use and structured in a smart way. Try it now and let this Blood Pressure Log Template excel worksheet sample inspire you.
We certainly encourage you to download this Blood Pressure Log Template excel worksheet now and use it to your advantage!
Also interested in other health and healthcare templates? AllBusinessTemplates is the most elaborate platform for downloading health templates and is updated every day with new health and healthcare related templates! Just search via our search bar or browse through our thousands of free and premium health forms and templates, contract, documents, letters, which are used by professionals in the healthcare industry. For example health care directive, mental health treatment plan, health management report, allergy log, healthy weekly meal plans, sick leave letter, health evaluation form, and much more...
DISCLAIMER
Nothing on this site shall be considered legal advice and no attorney-client relationship is established.
Leave a Reply. If you have any questions or remarks, feel free to post them below.
Related templates
Latest templates
Latest topics
- GDPR Compliance Templates
What do you need to become GDPR compliant? Are you looking for useful GDPR document templates to make you compliant? All these compliance documents will be available to download instantly... - Google Docs Templates
How to create documents in Google Docs? We provide Google Docs compatible template and these are the reasons why it's useful to work with Google Docs... - IT Security Standards Kit
What are IT Security Standards? Check out our collection of this newly updated IT Security Kit Standard templates, including policies, controls, processes, checklists, procedures and other documents. - Letter Format
How to format a letter? Here is a brief overview of common letter formats and templates in USA and UK and get inspirited immediately! - Google Sheets Templates
How to work with Google Sheets templates? Where to download useful Google Sheets templates? Check out our samples here.
cheese

