Bitcoin Altcoin Moon Sheet
Save, fill-In The Blanks, Print, Done!

Download Bitcoin Altcoin Moon Sheet
Adobe Acrobat (.pdf)- This Document Has Been Certified by a Professional
- 100% customizable
- This is a digital download (358.68 kB)
- Language: English
- We recommend downloading this file onto your computer.
When will ALT Coin season start? Check the vital statistics of the BTC Moon Cheat Sheet here!
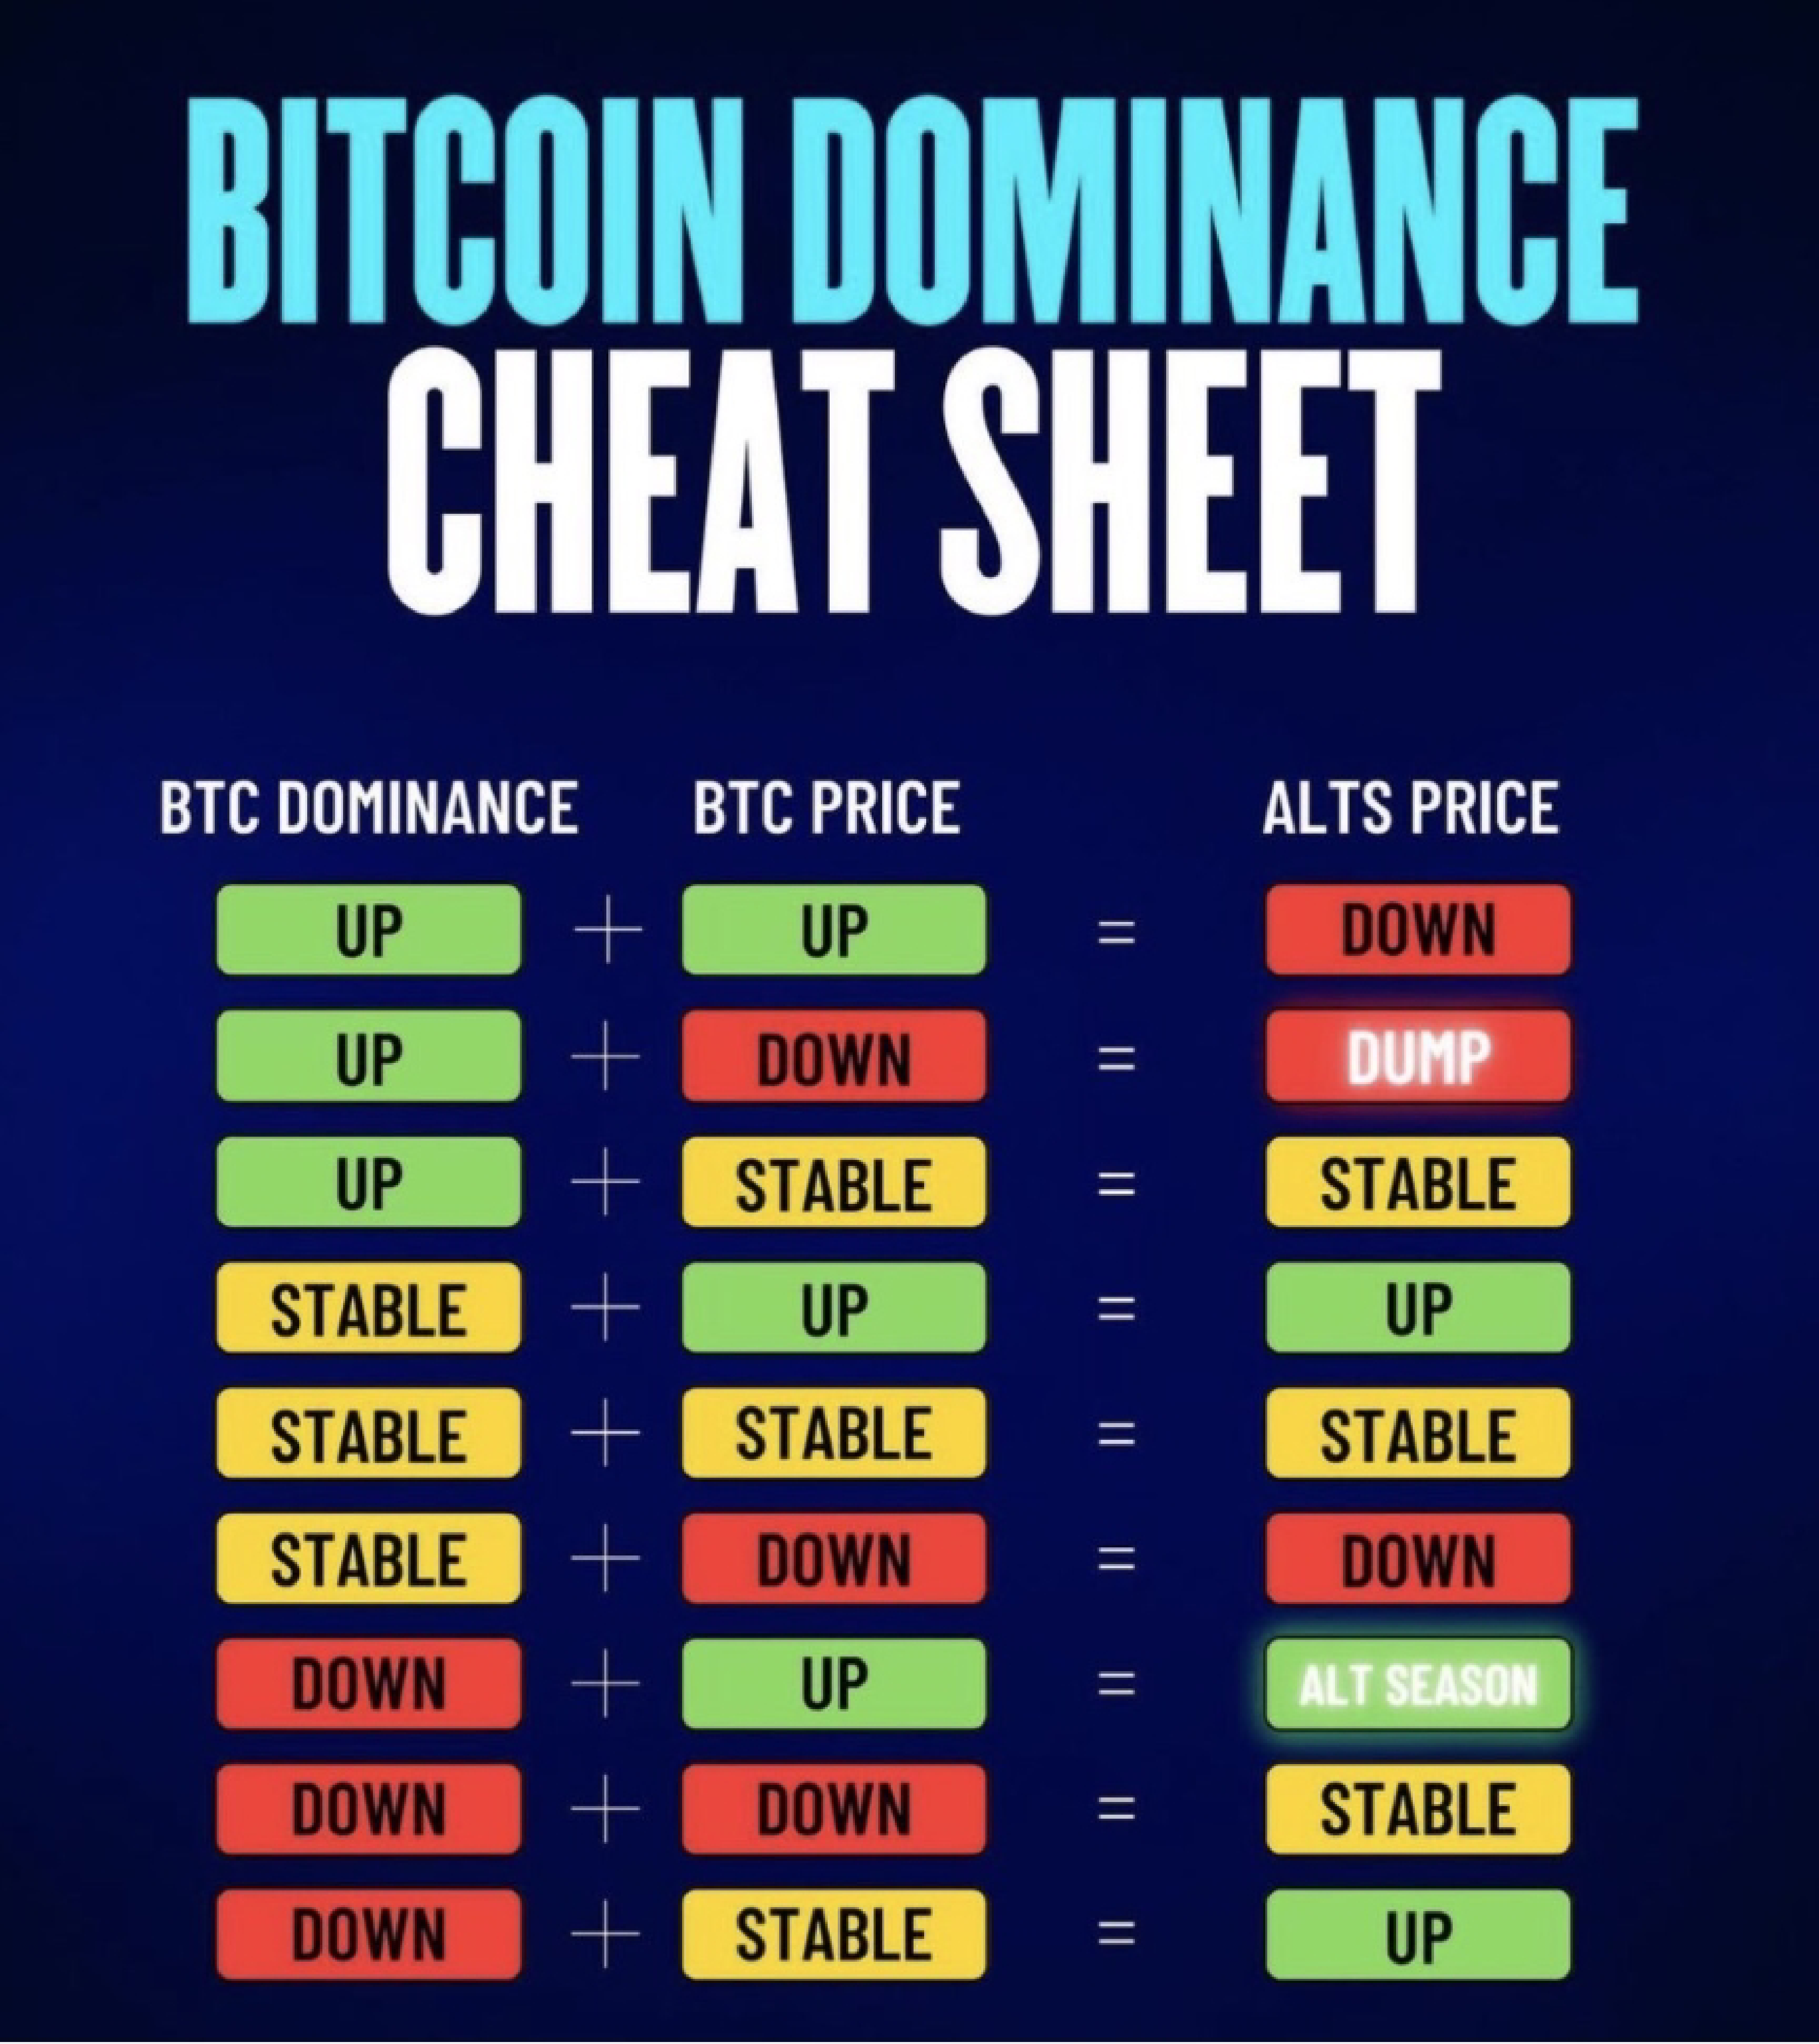
The Bitcoin Dominance Cheat or "Moon Sheet" is a popular framework for visualizing how Bitcoin's price and dominance affect the performance of altcoins. By analyzing both Bitcoin Dominance (BTC.D) and Bitcoin’s Price (BTC/USD), the Moon Sheet offers a guide for predicting whether altcoins will likely pump, dump, stay stable, or even enter an "alt season." Here’s a breakdown of the factors and potential outcomes:
Bitcoin Dominance (BTC.D): The percentage of the total cryptocurrency market capitalization that is held in Bitcoin. Higher dominance means Bitcoin holds a larger share of the market; lower dominance indicates more capital flowing into altcoins.
Bitcoin Price (BTC/USD): The current price of Bitcoin in USD, a crucial factor that influences overall market sentiment.
This ALT Coin Season analysis or BTC and ALT Moon Sheet divides outcomes into quadrants or zones based on the direction of BTC dominance and BTC price. Here’s how the zones typically work:
Zone 1: BTC Dominance Up + BTC Price Up
Outcome: Altcoins Dump
Explanation: When BTC price rises along with its dominance, capital flows primarily into Bitcoin rather than altcoins. This often leads to a sell-off or drop in altcoin prices, as traders move funds from altcoins to Bitcoin, capitalizing on Bitcoin's upward momentum.
Zone 2: BTC Dominance Up + BTC Price Down
Outcome: Altcoins Dump Hard
Explanation: If Bitcoin’s price is dropping and BTC dominance is increasing, it signals that the market is in a "risk-off" mode. Investors are likely moving into stable coins or Bitcoin for safety, causing significant declines in altcoin prices as investors pull capital out of riskier assets.
Zone 3: BTC Dominance Down + BTC Price Up
Outcome: Altcoins Stable or Slightly Up
Explanation: When BTC price is rising but dominance is falling, some funds are flowing into altcoins. This suggests a more balanced growth, where Bitcoin leads but altcoins hold steady or experience moderate gains. This often indicates a mild risk-on sentiment where traders are open to altcoin investments but still heavily favor Bitcoin.
Zone 4: BTC Dominance Down + BTC Price Down
Outcome: Potential Alt Season
Explanation: If both Bitcoin dominance and price are dropping, investors are moving capital into altcoins rather than Bitcoin. This dynamic can lead to an alt season, where capital inflow into altcoins accelerates, often resulting in substantial gains. This outcome is generally favorable for altcoins as investors diversify, betting on high-reward altcoins rather than Bitcoin.
Check our BTC Dominance cheat sheet, that shows you when to expect the start of the ALTCoin season...
For Altcoin Traders: The Moon Sheet can be used to time entries and exits based on the expected performance of altcoins in relation to Bitcoin’s trends.
For Bitcoin Maximalists: Tracking BTC dominance helps understand whether Bitcoin is dominating the market or if altcoins are starting to pull capital away from Bitcoin.
The Moon Sheet simplifies understanding these dynamics, but remember that external factors like news, regulations, or market events can always shift expected outcomes.
DISCLAIMER
Nothing on this site shall be considered legal advice and no attorney-client relationship is established.
Leave a Reply. If you have any questions or remarks, feel free to post them below.
Related templates
Latest templates
Latest topics
- Counter Offer Letter Templates
How to counter an offer , for example a job offer? Finding the Right Counter Offer Letter Example (With Free Templates) - Celcius To Farenheit Chart
How to convert celcius to farenheit? Celsius to Fahrenheit conversion charts and streamline your temperature calculations and conversions here. - Formal Complaint Letter of Harrasment
How do I write a formal complaint about harassment? Check out these formal complaint letter of harrasment templates here! - Google Sheets Templates
How to work with Google Sheets templates? Where to download useful Google Sheets templates? Check out our samples here. - Letter Format
How to format a letter? Here is a brief overview of common letter formats and templates in USA and UK and get inspirited immediately!
cheese


