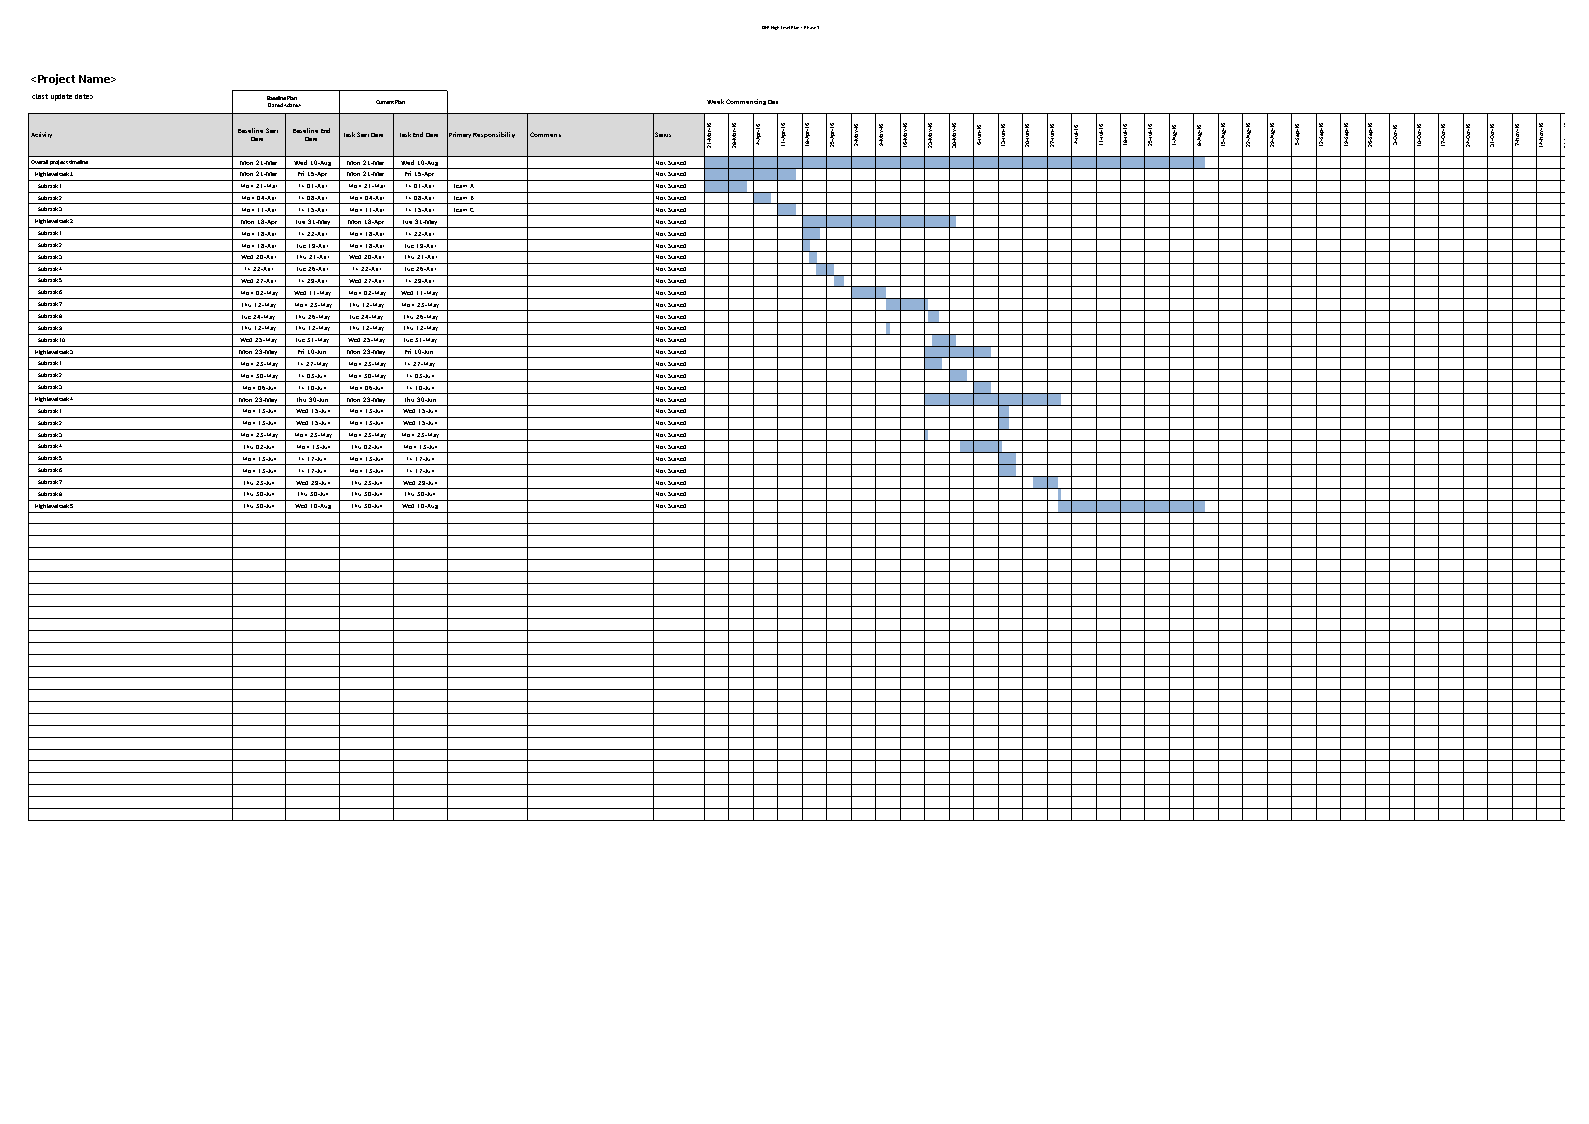
Project Management Gantt Chart Excel
Save, fill-In The Blanks, Print, Done!

Download Project Management Gantt Chart Excel
Microsoft Spreadsheet (.xlsx)- This Document Has Been Certified by a Professional
- 100% customizable
- This is a digital download (653.51 kB)
- Language: English
- We recommend downloading this file onto your computer.
- Data Setup:
- Organize your project data in a table with columns such as Task Name, Start Date, Duration, and any additional relevant information.
- Insert a Stacked Bar Chart:
- Select your data table and go to the "Insert" tab on the Excel ribbon.
- Choose "Bar Chart" and select "Stacked Bar."
- Adjust Chart Data:
- Right-click on the chart, choose "Select Data," and add a new series. Select your "Start Date" column for the new series.
- Now, you should have two series: one for the task duration and another for the task start date.
- Format Dates:
- Right-click on the horizontal axis, choose "Format Axis," and set the minimum and maximum bounds to match your project start and end dates.
- Format Bars:
- Format the task duration bars by adjusting the color, width, and other properties. You may also add labels or data labels for clarity.
- Add Milestones and Dependencies:
- You can add milestones as additional data series or use symbols, shapes, or labels on the chart to represent key project events.
- To show dependencies, use arrows or connectors to link related tasks on the Gantt Chart.
- Customization:
- Customize the chart by adding titles, labels, and legends to make it more informative.
- Adjust the chart layout and design to enhance readability.
- Update and Maintain:
- As your project progresses, update the Gantt Chart by adjusting task durations, start dates, and completion statuses.
Feel free to download this, or simply browse through our other basic or advanced template designs. They are intuitive and in several kinds of formats, such as PDF, WORD, XLS (EXCEL including formulas and can calculate sums automatically), etc.
Using this project management template guarantees that you will save time, cost, and effort and makes you more successful in your project, work, and business!
Completing your project management was never simpler! Download it now!
DISCLAIMER
Nothing on this site shall be considered legal advice and no attorney-client relationship is established.
Leave a Reply. If you have any questions or remarks, feel free to post them below.
Related templates
Latest templates
Latest topics
- Excel Templates
Where do I find templates for Excel? How do I create a template in Excel? Check these editable and printable Excel Templates and download them directly! - GDPR Compliance Templates
What do you need to become GDPR compliant? Are you looking for useful GDPR document templates to make you compliant? All these compliance documents will be available to download instantly... - Google Docs Templates
How to create documents in Google Docs? We provide Google Docs compatible template and these are the reasons why it's useful to work with Google Docs... - IT Security Standards Kit
What are IT Security Standards? Check out our collection of this newly updated IT Security Kit Standard templates, including policies, controls, processes, checklists, procedures and other documents. - Letter Format
How to format a letter? Here is a brief overview of common letter formats and templates in USA and UK and get inspirited immediately!
cheese


