Venn Diagram template with lining
Save, fill-In The Blanks, Print, Done!

Download Venn Diagram template with lining
Microsoft Word (.docx)Or select the format you want and we convert it for you for free:
- This Document Has Been Certified by a Professional
- 100% customizable
- This is a digital download (71.89 kB)
- Language: English
- We recommend downloading this file onto your computer.

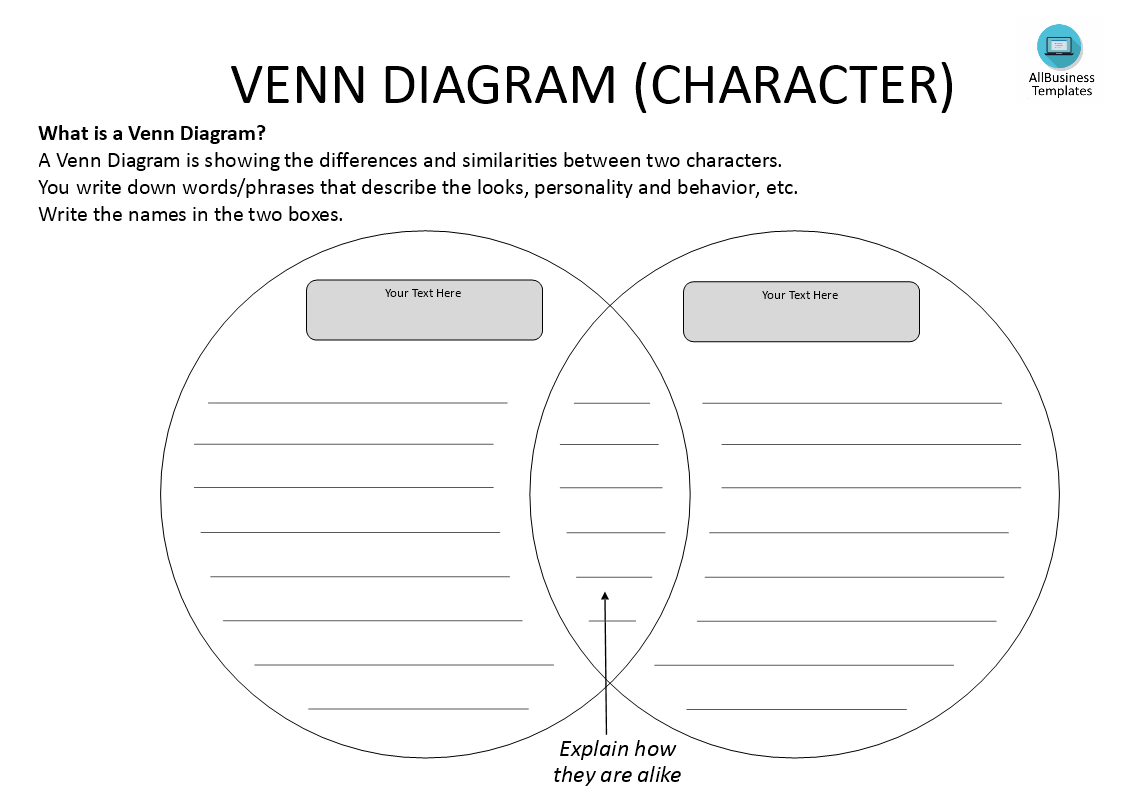
Are you looking for a simple tool to explain a comparison, including similarities and differences, between two options? Our Venn diagram template has a thick black lining around the overlapping circles, making it easy to compare and contrast different ideas. Try to create a Venn diagram and download this Venn diagram template now!
How to work with a Venn Diagram?
Working with a Venn Diagram involves creating, interpreting, or analyzing the diagram to represent relationships between sets and their elements. Here's a step-by-step guide on how to work with a Venn Diagram:
Creating a Venn Diagram:
- Identify Sets:
- Determine the sets you want to compare. Each circle in the Venn diagram typically represents a set.
- Draw Circles:
- Use a compass or a suitable drawing tool to create circles on paper or a digital canvas. The circles should overlap, and their positions and sizes should reflect the relationships between the sets.
- Label Sets:
- Label each circle with the name of the corresponding set. This helps clarify which sets you are comparing.
- Place Elements:
- If you have specific elements or items to compare, place them inside the appropriate circles or in the overlapping areas.
- Intersection:
- Elements in the overlapping areas represent the intersection of sets. Interpret these elements as commonalities shared by the sets.
- Non-overlapping Regions:
- Elements in the individual circles, outside the overlapping areas, represent unique characteristics or elements exclusive to each set.
- Counting Elements:
- Count the number of elements in each set and in the overlapping areas to analyze the size and relationships between sets.
- Comparing Sets:
- Examine the diagram to understand how sets relate to each other. Look for similarities and differences.
- Set Operations:
- Apply set operations (union, intersection, complement) to analyze relationships mathematically.
- Clarity:
- Keep the diagram clear and simple. Use labels and colors judiciously to enhance clarity.
- Consistency:
- Maintain consistent sizing and positioning of circles to ensure accurate representation.
- Use Software:
- Consider using digital tools or software for flexibility and ease of editing.
- Annotate:
- Add explanatory notes or captions to provide context and details.
Working with a Venn Diagram involves a combination of artistic representation, logical analysis, and interpretation of set relationships. Whether you're using it for problem-solving, data analysis, or educational purposes, the key is to convey information accurately and effectively.
Click directly on 'Open with Google Docs' or download our sample Venn Diagram letter template as a Word template now to enhance efficiency! Your success in delivering a well-structured and effective Venn Diagram awaits.
DISCLAIMER
Nothing on this site shall be considered legal advice and no attorney-client relationship is established.
Leave a Reply. If you have any questions or remarks, feel free to post them below.
Circle Templates
Do you need free printable circle templates, circle shapes or outlines? Find here several circle templates in different sizes and extensions, all free to download!
Read moreRelated templates


Latest templates
Latest topics
- GDPR Compliance Templates
What do you need to become GDPR compliant? Are you looking for useful GDPR document templates to make you compliant? All these compliance documents will be available to download instantly... - Google Docs Templates
How to create documents in Google Docs? We provide Google Docs compatible template and these are the reasons why it's useful to work with Google Docs... - IT Security Standards Kit
What are IT Security Standards? Check out our collection of this newly updated IT Security Kit Standard templates, including policies, controls, processes, checklists, procedures and other documents. - Letter Format
How to format a letter? Here is a brief overview of common letter formats and templates in USA and UK and get inspirited immediately! - Google Sheets Templates
How to work with Google Sheets templates? Where to download useful Google Sheets templates? Check out our samples here.
cheese