Gantt Chart Template sample
Save, fill-In The Blanks, Print, Done!

Download Gantt Chart Template sample
Microsoft Spreadsheet (.xls)Or select the format you want and we convert it for you for free:
- This Document Has Been Certified by a Professional
- 100% customizable
- This is a digital download (65.5 kB)
- Language: English
- We recommend downloading this file onto your computer.
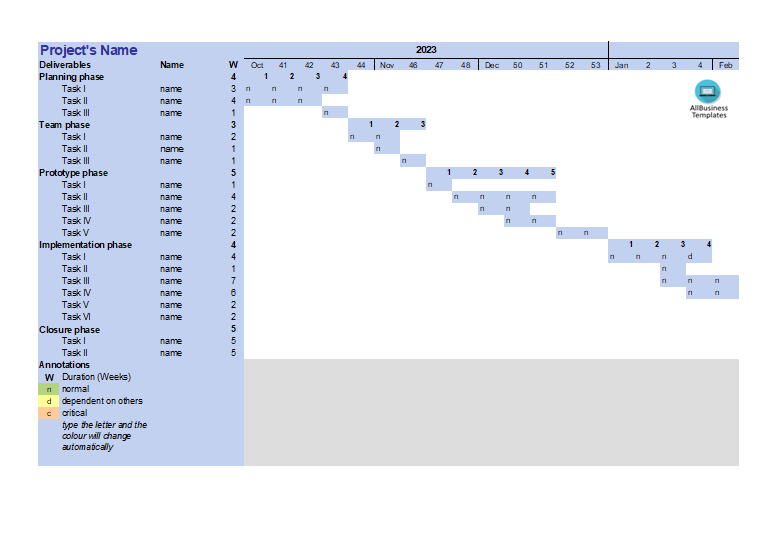
- List all the tasks involved in your project and determine their start and end dates. Make sure to include all relevant details such as task names, start dates, and durations.
- Open a new Excel spreadsheet and set up your data. You may want to use the following column headings:
- Task Name: Column for task names.
- Start Date: Column for the start date of each task.
- Duration: Column for the duration of each task.
- End Date: Column for the calculated end date of each task.
- In the "End Date" column, use a formula to calculate the end date by adding the start date and duration.
- Select the data you've entered, including the task names, start date, duration, and end date columns. Go to the "Insert" tab and select "Bar Chart" or "Stacked Bar Chart."
- Format the chart to make it look like a Gantt Chart:
- Adjust Dates: Ensure that the dates on the chart align with your project timeline.
- Format Bars: Format the bars to represent the tasks. You may want to color them differently for better visibility.
- Add Milestones: If there are milestones in your project, you can add them as additional data series or by formatting specific bars differently.
- Customize the axis labels to represent the timeline of your project accurately.
- If your tasks have dependencies, you can represent them by adjusting the bars on the chart accordingly. You might use arrows or connectors to show the flow of tasks.
- Make any final adjustments to improve the visual appeal and clarity of your Gantt Chart. This may include adding a title, adjusting colors, and ensuring that the chart is easy to read.
Adequate communication is essential in order to finish projects successfully. In order to gain truthful and accurate information, you need to make sure that program- or project managers are able to make rational and correct decisions. For those who have, what we call, a "high-performance mindset”, we know they prefer to work with the latest update of professional project management templates, in order to achieve their goals faster. We are certain this project template will be of value.
Feel free to download this Gantt Chart Template sample, or simply browse through our website to find other basic or advanced template designs. They are intuitive and available in several kinds of formats, such as PDF, WORD, XLS (EXCEL includes formulas and can calculate sums automatically), etc.
Using this project management template guarantees that you will save time, cost and efforts and makes you more successful in your project, work, and business!
Download this project management template now! Completing your Gantt Chart Template sample was never simpler!
DISCLAIMER
Nothing on this site shall be considered legal advice and no attorney-client relationship is established.
Leave a Reply. If you have any questions or remarks, feel free to post them below.
Excel Templates
Where do I find templates for Excel? How do I create a template in Excel? Check these editable and printable Excel Templates and download them directly!
Read moreRelated templates
Latest templates
Latest topics
- Excel Templates
Where do I find templates for Excel? How do I create a template in Excel? Check these editable and printable Excel Templates and download them directly! - GDPR Compliance Templates
What do you need to become GDPR compliant? Are you looking for useful GDPR document templates to make you compliant? All these compliance documents will be available to download instantly... - Google Docs Templates
How to create documents in Google Docs? We provide Google Docs compatible template and these are the reasons why it's useful to work with Google Docs... - IT Security Standards Kit
What are IT Security Standards? Check out our collection of this newly updated IT Security Kit Standard templates, including policies, controls, processes, checklists, procedures and other documents. - Letter Format
How to format a letter? Here is a brief overview of common letter formats and templates in USA and UK and get inspirited immediately!
cheese


