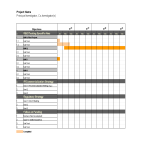
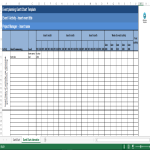
Blanko Gantt-grafiek Excel

Opslaan, invullen, afdrukken, klaar!
De beste manier om een Blanko Gantt-grafiek Excel te maken? Check direct dit professionele Blanko Gantt-grafiek Excel template!
Beschikbare bestandsformaten:
.xls- Gevalideerd door een professional
- 100% aanpasbaar
- Taal: English
- Digitale download (59.5 kB)
- Na betaling ontvangt u direct de download link
- We raden aan dit bestand op uw computer te downloaden.
Zakelijk Gantt diagram Gantt diagram Excel Technologie Activiteit dagen Taak Lege Gantt grafiek Excel Leeg Gantt diagram Excel voorbeeld Leeg Gantt diagram Excel voorbeeld Gepantserde gevechtsvoertuigen Militaire uitrusting van de Verenigde Staten Wereldoorlog Ii gepantserde gevechtsvoertuigen Militaire uitrusting
How to create a Blank Gantt Chart Excel? Do you need an Excel template for a Blank Gantt Chart? We have created a Gantt Chart template in Excel format that can help you plan and track your project tasks. It's free to use and you can easily customize it to fit your project. An easy way to start completing your document is to download this example Blank Gantt Chart Excel template now!
A blank Gantt chart in Excel is a template that you can use as a starting point to create your own Gantt chart. A Gantt chart is a popular project management tool that visually represents the schedule of tasks and activities over time. In Excel, you can create a Gantt chart using a stacked bar chart to represent the duration of tasks.
Here's a step-by-step guide on how to create a blank Gantt chart in Excel:
- Open Excel:
- Open Microsoft Excel on your computer.
- Set Up Your Data:
- In Excel, organize your data with columns for Task Name, Start Date, Duration, and End Date.
- Create a Stacked Bar Chart:
- Highlight the data you've entered.
- Insert a Bar Chart:
- Go to the "Insert" tab in the Excel ribbon.
- Choose a Stacked Bar Chart:
- Select the "Bar Chart" option, and choose the "Stacked Bar" chart type. This will be the foundation for your Gantt chart.
- Format the Chart:
- Format the chart to represent the tasks and their durations accurately. You may need to adjust the axis, colors, and labels to make it visually appealing and easy to understand.
- Adjust Dates on the Axis:
- Make sure the dates on the chart's horizontal axis align with your project timeline. You can do this by adjusting the axis settings.
- Add Task Labels:
- Add task labels to each bar in the chart. This helps identify each task.
- Format for Clarity:
- Adjust colors, fonts, and other formatting options to make the Gantt chart clear and easy to read.
- Add Milestones (Optional):
- You can add milestone markers for important events or achievements in your project.
- Title and Label:
- Add a title and labels to the chart to provide context.
- Save the Gantt Chart:
- Save your Excel file to retain the Gantt chart for future reference.
Using a blank Gantt chart template in Excel saves time and provides a structured starting point for creating a visual project timeline. You can customize the chart based on your project's needs, including adding or removing tasks, adjusting timelines, and incorporating other project details.
Using this blank Gantt chart Excel template guarantees you will save time, cost, and effort! Completing documents has never been easier!
Download this blank Gantt chart Excel template now for your own benefit!
DISCLAIMER
Hoewel all content met de grootste zorg is gecreërd, kan niets op deze pagina direct worden aangenomen als juridisch advies, noch is er een advocaat-client relatie van toepassing.
Laat een antwoord achter. Als u nog vragen of opmerkingen hebt, kunt u deze hieronder plaatsen.


