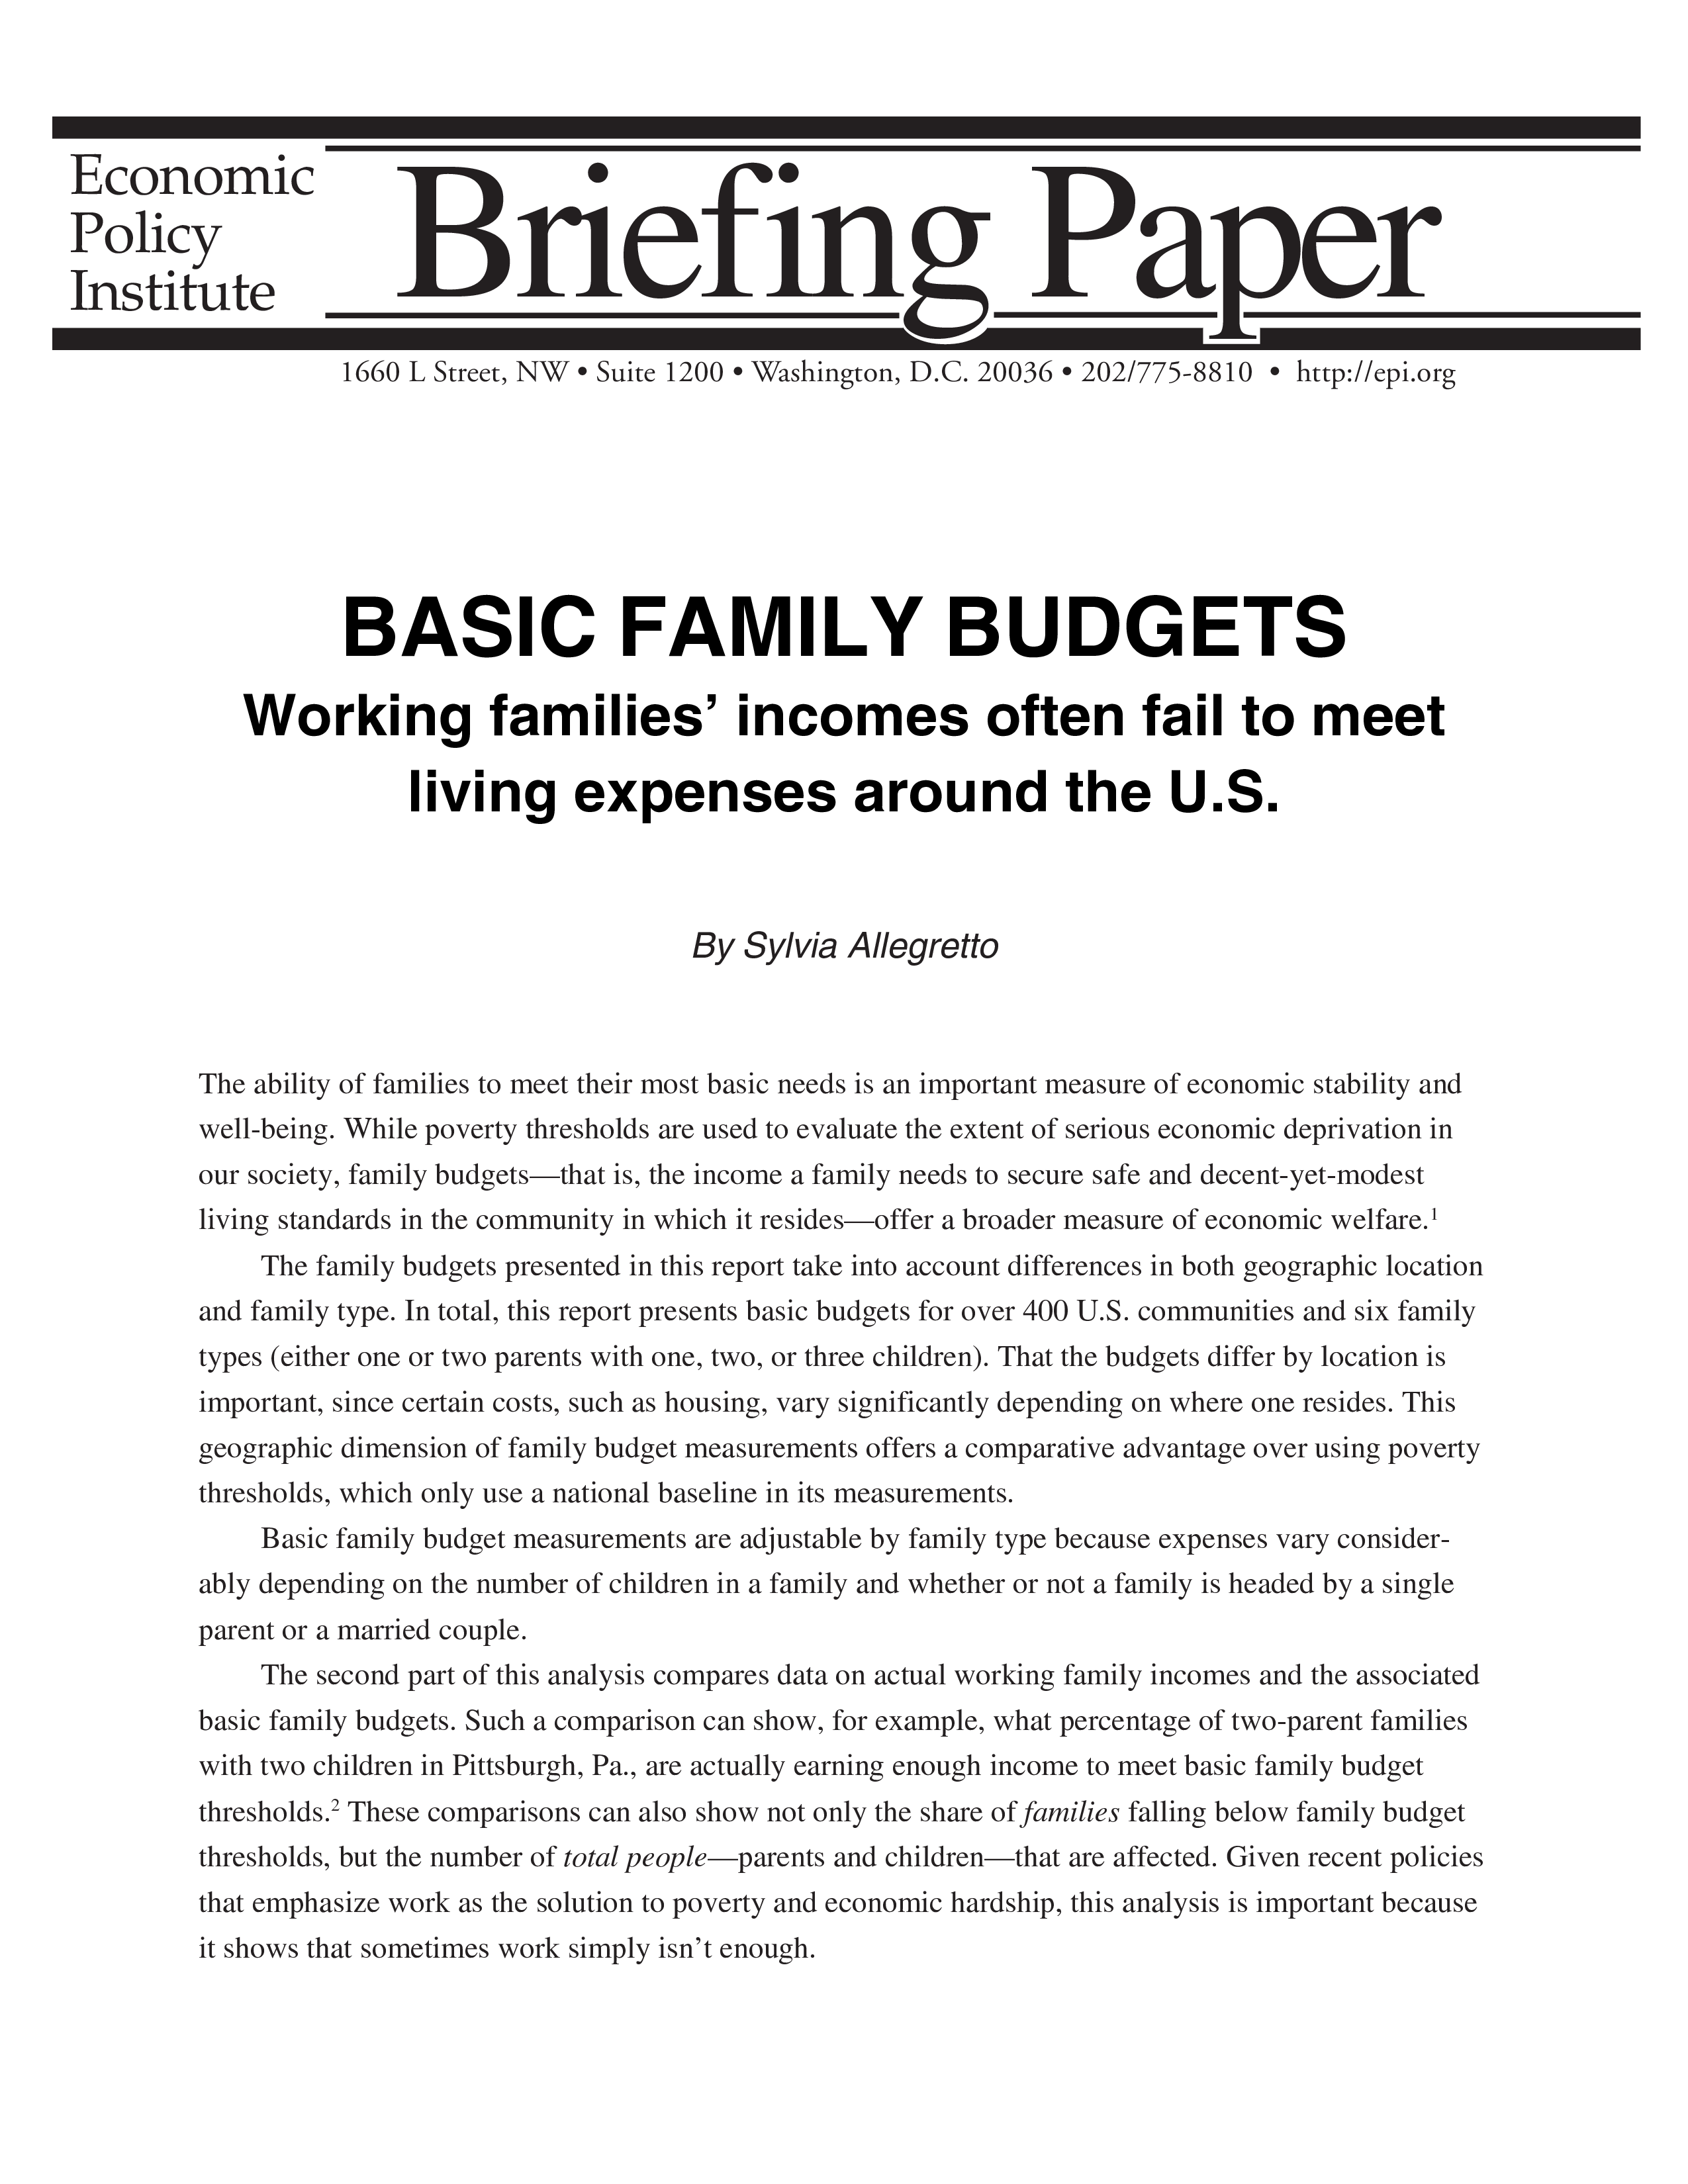
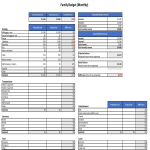
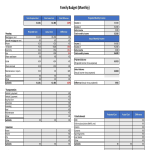
Annual Family Budget

Enregistrer, Remplir les champs vides, Imprimer, Terminer!
How to create an annual Family Budget? Download this Annual Family Budget template now!
Formats de fichiers gratuits disponibles:
.pdf- Ce document a été certifié par un professionnel
- 100% personnalisable
Business Entreprise Finance La finance budget le budget family famille Basic De base Budgets Les budgets Annual Budget Budget annuel Families Familles
Whether you manage the finances at your work or at home, adequate communication is essential. Accurately keeping track of financial data is not only critical for running the day-to-day operations of your small business, but it is also important when seeking funds from investors or lenders to grow your business to the next level. Having correct and accurate information exchange, enables and ensures you, you are able to make the right decisions. For those working in Finance, it's important to be accurate and always double-check every detail.
Feel free to download our basic or advanced finance templates, they are intuitive and in several kinds of formats, such as PDF, WORD, PPT, XLS (Excel includes formulas and can calculate sums automatically), etc.
Using this Annual Family Budget financial template guarantees that you will save time, cost and efforts and enables you to reach the next level of success in your project, education, work, and business!
Download this professional Annual Family Budget template now!
Looking for more? Our collection of financial documents, templates, forms, and spreadsheets includes templates designed specifically for small business owners, private individuals, or Finance Staff. Find financial projections to calculate your startup expenses, payroll costs, sales forecast, cash flow, income statement, balance sheet, break-even analysis, financial ratios, cost of goods sold, amortization and depreciation for your company. These financial templates also work with OpenOffice and Google Spreadsheets, so if you are operating your business on a very tight budget, hopefully, you'll be able to make these financial templates work for you as well.
6 TABLE 2 Share of families with income less than family budget, poverty line, and twice poverty (by demographic characteristics) Share of families below: Family budget Poverty line Twice poverty line ALL 29.7 9.4 28.0 Race/ethnicity White African American Hispanic Other 20.1 52.8 56.8 28.3 5.5 21.2 18.7 7.3 19.8 47.6 52.8 25.3 Education Less than high school degree High school degree only Some college College degree 69.2 41.5 29.8 8.7 28.9 13.6 7.8 1.7 68.7 40.5 26.9 7.4 Age 18-30 31-45 46+ 47.9 21.3 21.9 17.9 5.4 6.0 46.8 19.5 20.1 Work status Full-time, full-year Less than full-time, full-year 22.8 42.5 4.2 19.0 20.6 42.1 Family type One adult with one child One adult with two children One adult with three children Two adults with one child Two adults with two children Two adults with three children 59.9 73.7 92.5 18.5 19.8 36.2 20.8 31.4 55.6 3.7 5.5 10.4 50.8 67.0 86.9 16.0 22.1 34.4 Location City Suburbs Rural 42.5 23.3 30.5 14.2 5.7 12.3 37.6 19.7 37.0 Region Northeast Midwest South West 30.4 23.4 31.3 32.7 7.4 7.6 11.8 8.9 22.5 24.1 32.6 29.2 More than two out of 10 families headed by a full-time, full-year worker fall below basic budget levels.. Work supports such as the Earned Income Tax Credit (EITC), child care 8 TABLE 3 Percentage and number of persons in families with incomes less than family budgets (by state) Below family budgets Below family budgets Number Number State/region Percent State/region (in thousands) Northeast Maine New Hampshire Vermont Massachusetts Rhode Island Connecticut New York New Jersey Pennsylvania 28.5 28.9 21.9 20.3 31.8 28.9 22.3 35.3 23.3 23.5 2,638 47 43 22 350 50 151 1,106 383 485 South Delaware Maryland District of Columbia Virginia West Virginia North Carolina South Carolina Georgia Florida Kentucky Tennessee Alabama Mississippi Arkansas Louisiana Oklahoma Texas 29.9 23.4 20.2 48.0 23.4 38.1 32.7 25.2 25.6 31.0 27.7 25.8 33.8 29.6 26.8 28.2 34.9 35.0 5,494 31 179 31 284 86 476 177 451 822 217 287 308 134 124 227 198 1
AVERTISSEMENT
Rien sur ce site ne doit être considéré comme un avis juridique et aucune relation avocat-client n'est établie.
Si vous avez des questions ou des commentaires, n'hésitez pas à les poster ci-dessous.


