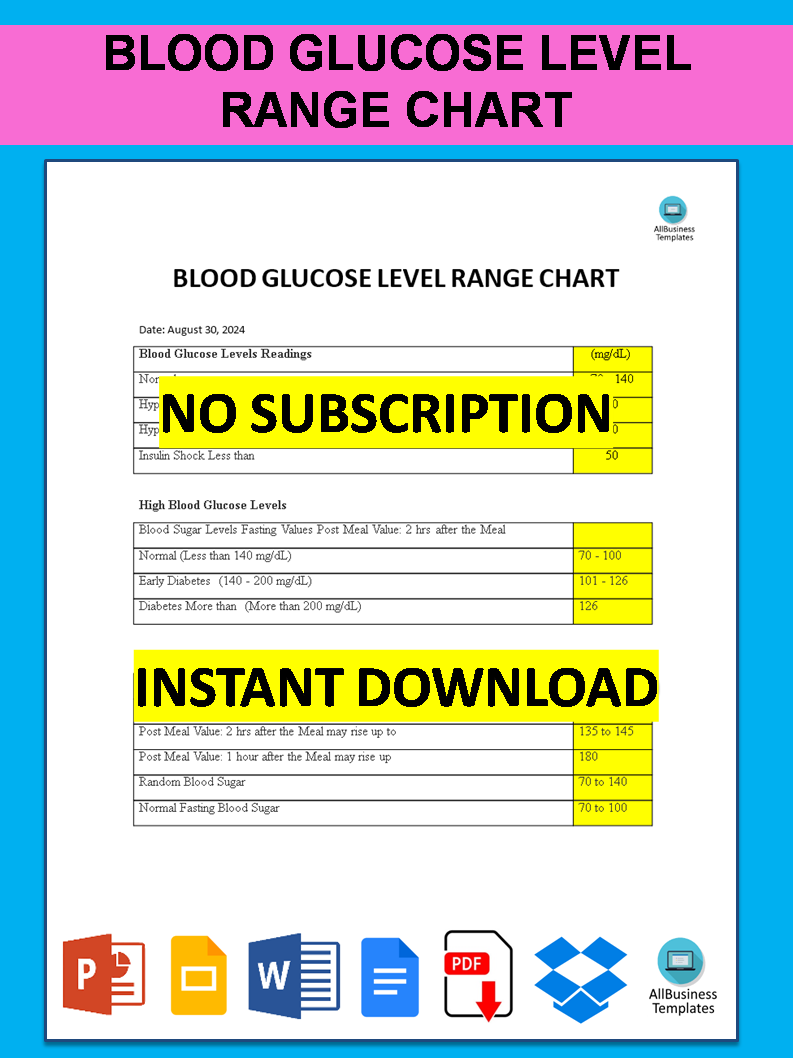
Blood Glucose Level Range Chart

Guardar, completar los espacios en blanco, imprimir, listo!
How to create a blood glucose level range chart? Would you like a chart template that contains blood sugar levels? Download this sample chart template now!
Formatos de archivo disponibles:
.docx- Este documento ha sido certificado por un profesionall
- 100% personalizable
Business Negocio Health Salud Blood Sangre Mg Dl Normal Charts Cartas Sugar Azúcar Blood Glucose Level Chart Tabla de nivel de glucosa en sangre Editable Blood Glucose Level Charts Gráficos de niveles de glucosa en sangre editables
What are the regulations for documenting blood glucose ranges? Would you like a chart template that contains blood sugar levels? We have one that is downloadable and serves as an example. The document also possesses useful suggestions to assist you in maintaining your glucose levels within the recommended range.
A blood glucose level range chart is an important reference tool that can display the normal, pre-diabetic, and diabetic ranges of blood sugar levels for various situations. It helps patients as well as health care providers understand if an individual’s blood sugar levels are in a healthy range or indicate possible problems such as diabetes.
Blood sugar level range charts: Why are they important?
Several significant aspects related to blood sugar management and understanding make a blood glucose level range chart essential. Here are some of the main ones:
- Identifying Diabetes and Prediabetes
- Advanced Detection: The chart can be used to identify diabetes and prediabetes through comparison with standardized blood sugar levels. This will lead to timely intervention that may avoid progression into chronically ill states.
- Definite Instructions: For instance, it gives definite instructions about normal, prediabetic, or diabetic blood glucose levels which help healthcare providers make a precise diagnosis.
- Diabetes Management
- For individuals with diabetes, the chart is a crucial day-to-day monitoring device. It enables them to see whether their blood sugar is in the desired range so that they can adjust their diets, medication, or insulin dosage.
- By abiding by a certain range of blood glucose levels, people can minimize the likelihood of developing complications related to diabetes like heart disease kidney damage nerve injuries, or even sight problems.
- Long-Term Health Awareness
- Tracking Trends: The chart assists in monitoring long-term blood sugar levels, especially through measures such as HbA1c which indicates how well one has managed it over time allowing for necessary adjustments on treatment plans if need be.
- Lifestyle Modifications: It also sheds light on how lifestyle factors such as diet, exercise, and stress can affect blood sugar levels enabling individuals to make decisions based on solid facts towards better health choices.
- Teaching and Knowledge
- Patient Education: The chart also serves as an educational tool that helps patients and their relatives understand the essence of maintaining healthy ranges of blood glucose levels alongside its associated significance.
- Motivation: Monitoring trends throughout this process serves as a source of motivation for people who have diabetes to comply with their treatment regimens since one may see how different factors including lifestyle changes influence his/her blood glucose level when compared against reference ranges established earlier.
- Prevention of Disease Progression
- Intervention: For those whose blood sugar levels are on the edge of prediabetes, the chart acts as a visual guide that indicates they have above-normal blood sugar levels, hence necessitating changing their lifestyle to avoid developing diabetes.
- Personalized Care: This allows personalized care, whereby healthcare providers can formulate treatment and management plans based on a patient’s glucose results.
- Emergency Situations
- Identifying Hypoglycemia or Hyperglycemia: The chart assists in the quick identification of dangerously low (hypoglycemia) or high (hyperglycemia) blood sugar levels that need urgent attention to avert severe complications.
In summary, a blood glucose level range chart is an important tool in diagnosing, managing, and preventing diabetes, as well as enhancing general metabolism health.
Just click “Open with Google Docs” or download our sample template for the blood sugar levels range chart so you can use it in your own Word documents and boost your efficiency! seize this opportunity to submit a coherent and useful graph
DESCARGO DE RESPONSABILIDAD
Nada en este sitio se considerará asesoramiento legal y no se establece una relación abogado-cliente.
Deja una respuesta. Si tiene preguntas o comentarios, puede colocarlos a continuación.
