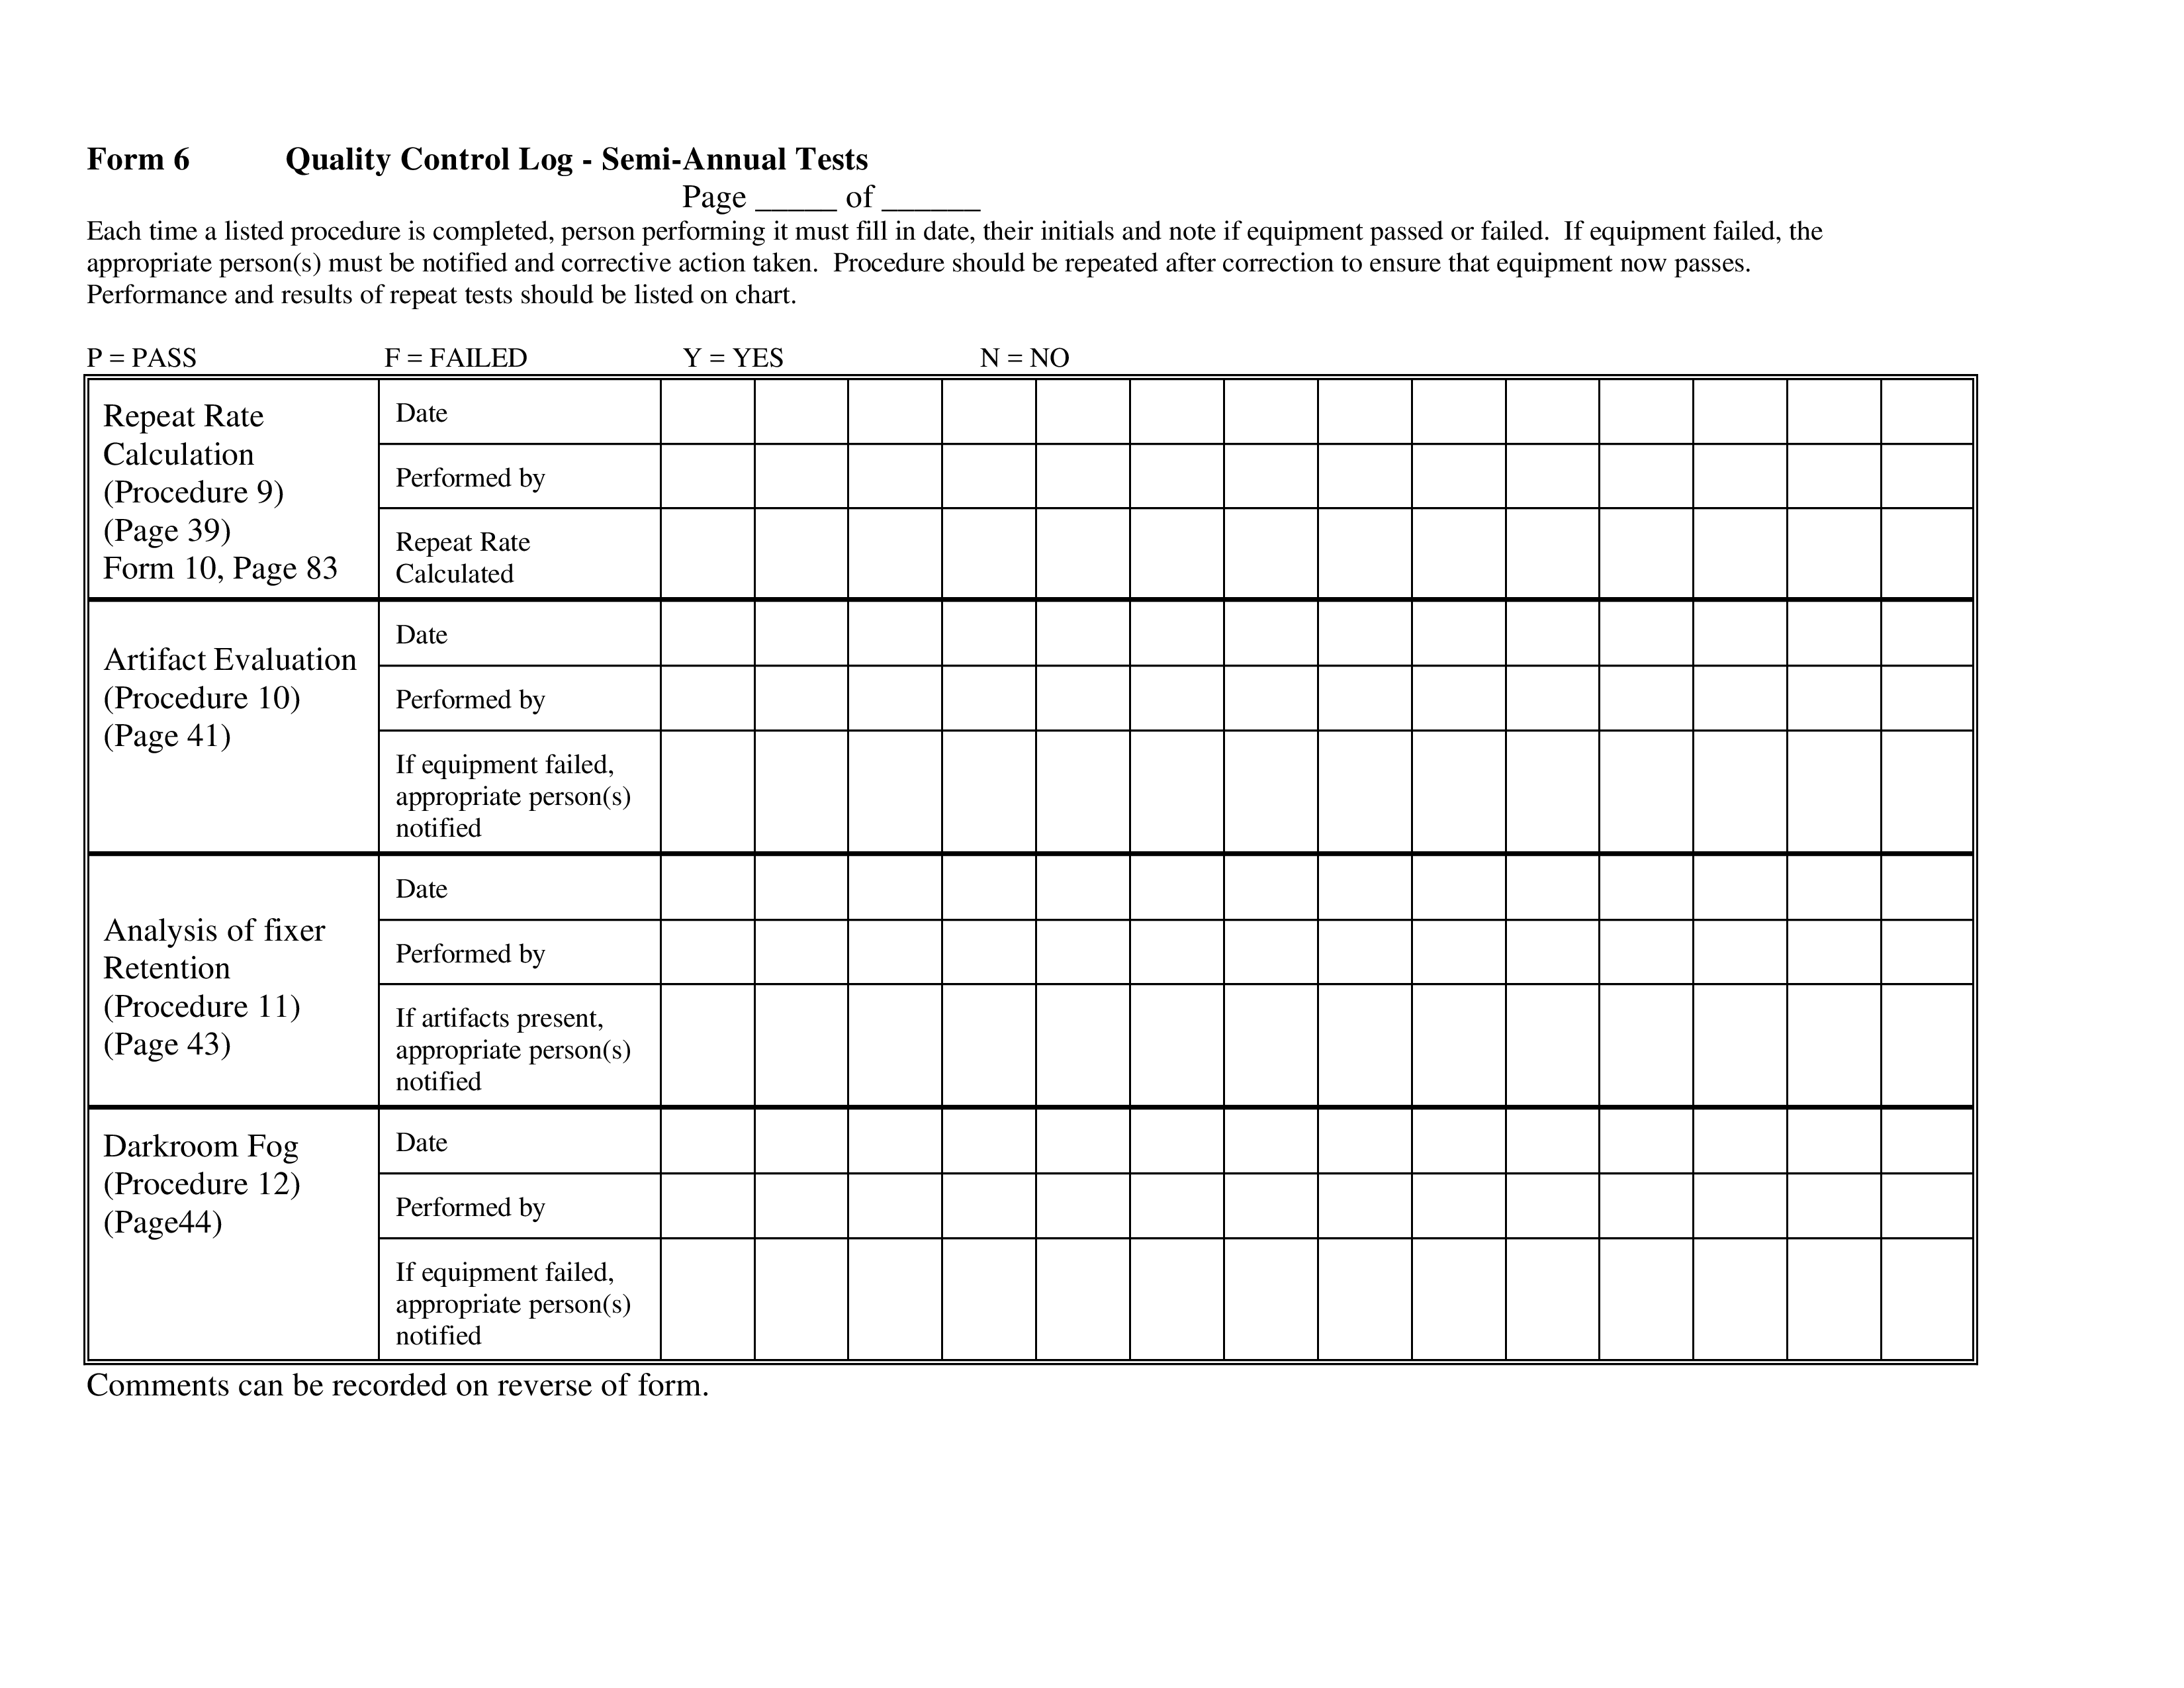
Blank control charts printable

Guardar, completar los espacios en blanco, imprimir, listo!
How to create a Control Chart? Start with example blank control charts that are downloadable and ready to print.
Formatos de archivo disponibles:
.pdfOtros idiomas disponibles::
- Este documento ha sido certificado por un profesionall
- 100% personalizable
math mates mathematics matemáticas Research Investigación statistics estadística Blank Control Chart Cuadro de control en blanco process capability chart spc tools excel run chart template statistical process control charts examples how to create a control chart in excel Plot Diagram Diagrama de trama dmaic monitoring plan six sigma one pager green belt control plan template lean six sigma project closure innovation transfer opportunities visual management checklist how to calculate how to calculate control limits i mr chart minitab capability analysis minitab capability analysis minitab standard deviation formula minitab control chart specification limit control charts cheat sheet 3 sigma p chart in excel make a p chart spc p chart excel download sample control control chart problems solutions r chart calculator ucl formula control chart constants control limits are quality control in r blank control charts blank control charts example blank control charts sample blank control chart paper format control charts math control charts statistical control charts
How to create a Control Chart? Start with example blank control charts that are downloadable and ready to print.
The Control Charts in this document is very useful and the most common types of control charts, for example, the X-Bar chart (which allows you to do plotting the mean of a sample over time). Also, you can find the S-chart (plotting the sample standard deviation over time and the R-chart (to do plotting of a range or Max-Min of a sample over time).
These blank control charts are based on the terminology used and that explains the formulas and steps for creating these control charts. This file contains blank control chart templates that can be used for statistical analysis. For example for Mean and Range, or sample Mean and Standard Deviation (2 worksheets in one). You can just put your own data in the charts, in order to visualize the data. Control limits are calculated based on the data you enter. In the X-bar & R control chart, the number of observations per sample (n) can be between 2 and 25. In the X-bar & S chart, n must be greater than 4.
Although there are many Statistical Process Control (SPC) software tools available to analyze and visualize data, it happens that researchers also create control charts in Excel or on a hardcopy.
For those, these blank Control Chart Templates can be very useful. Also, it can function as educational tools to teach children or adults and to make equations.
Download this Blank control charts now.
DESCARGO DE RESPONSABILIDAD
Nada en este sitio se considerará asesoramiento legal y no se establece una relación abogado-cliente.
Deja una respuesta. Si tiene preguntas o comentarios, puede colocarlos a continuación.

