Gantt Chart Timeline

Guardar, completar los espacios en blanco, imprimir, listo!
How to make a professional Gantt Chart Timeline? What kind of Gantt Chart Timeline template do you need? Download our Gantt Chart template now which can be customizable to fit your needs.
Formatos de archivo disponibles:
.doc- Este documento ha sido certificado por un profesionall
- 100% personalizable
Business Negocio Projectmanagement Gestión de proyectos gantt Gantt timeline línea de tiempo time hora Chart Gráfico Tasks Tareas Downloadable Timeline Línea de tiempo descargable
How to make a professional Gantt Chart Timeline? What kind of Gantt Chart Timeline template do you need? Gantt Charts are a popular project management tool that enables you to visualize tasks, resources, and durations. They also help you stay on track and ensure your project is completed on time. Our Gantt Chart template is available to download and customizable to fit your needs.
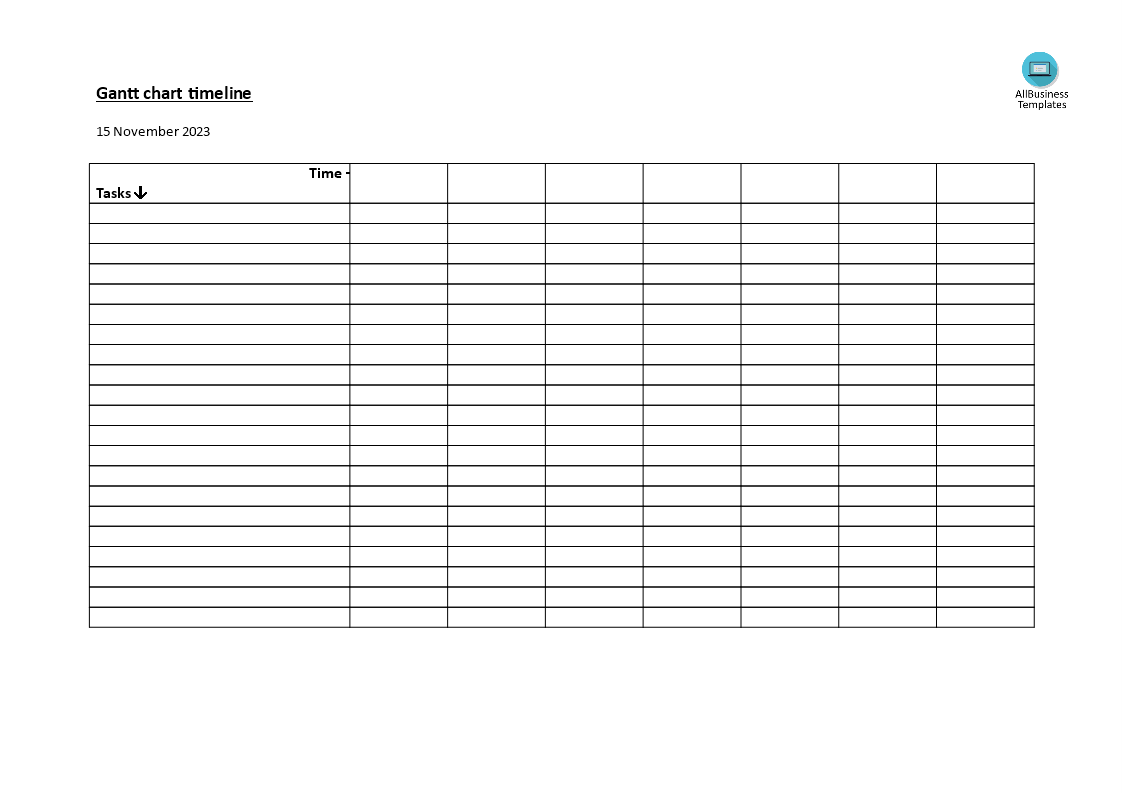
A Gantt Chart Timeline works by visually representing the schedule of tasks and activities over time. It provides a graphical view of the project's timeline, showing when tasks start when they end, and how they relate to each other. The Gantt Chart Timeline is an integral part of the overall Gantt Chart, and it serves as a powerful tool for project planning, scheduling, and communication. Here's how it works:
- Task List: The first step is to create a list of all the tasks or activities involved in the project. Each task is given a name, and its details, such as start date, duration, and end date, are determined.
- Timeline: The Gantt Chart Timeline typically consists of a horizontal axis that represents time, divided into increments such as days, weeks, or months. The timeline is positioned along the top or bottom of the chart.
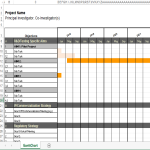
- Task Bars: Each task is represented by a horizontal bar along the timeline. The position of the bar indicates when the task is scheduled to start, and the length of the bar corresponds to the duration of the task. The end of the bar represents the task's completion date.
- Dependencies: If there are dependencies between tasks (i.e., one task must be completed before another can start), these dependencies are illustrated by the positioning of the taskbars. Connecting lines or arrows may be used to visually represent the relationships between tasks.
- Milestones: Important project milestones, such as key deliverables or significant achievements, are often marked on the Gantt Chart Timeline. Milestones are represented by distinct symbols or markers, helping to highlight critical points in the project.
- Color Coding: Tasks, milestones, or other elements on the chart may be color-coded to provide additional information or to differentiate between different types of activities or phases in the project.
- Resource Allocation: The Gantt Chart Timeline can also be used to visualize the allocation of resources over time. This helps in managing and optimizing resource utilization throughout the project.
- Progress Tracking: As the project progresses, the Gantt Chart Timeline is updated to reflect the actual start and finish dates of tasks. This allows project managers and team members to track progress in real-time and make adjustments as needed.
In summary, a Gantt Chart Timeline provides a dynamic and visual representation of a project's schedule, making it easier for project managers and team members to understand the timing, dependencies, and overall flow of tasks throughout the project lifecycle. It serves as a valuable communication tool, aiding in project planning, coordination, and tracking. Various project management tools and software offer features for creating and updating Gantt Chart Timelines.
Completing your project management Gantt Chart Timeline was never simpler! Download it now!
DESCARGO DE RESPONSABILIDAD
Nada en este sitio se considerará asesoramiento legal y no se establece una relación abogado-cliente.
Deja una respuesta. Si tiene preguntas o comentarios, puede colocarlos a continuación.


