Gráfico de precios plantillas, contratos y formularios.
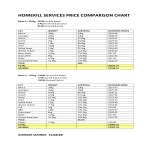
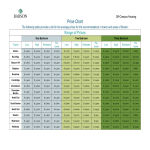
What does price charting mean? How to make a price chart?
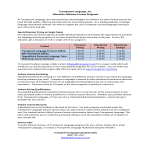
A price chart is an easy-to-read overview with prices for services or products offered. We give you instant access to Price chart templates to help you out. Find all the charts, kits, forms, templates, checklists, and more than you will ever need during your career or business. Like the: Price Chart template, Waterfall Charts in Cell, Average Chart, Chart Excel, stacked Bar Chart With Percentage, Assessment Charts, Project Gantt Charts, Calorie Chart, Diet Chart Template, etc.
All charting methods shown above record one data point for each time period. No matter how much the price moves, each day or week displayed is a point, bar or candlestick on the time scale.
A point, bar or candlestick is drawn to mark price movements even if the price remains the same on a daily or weekly basis. Contrary to this method, point and figure charts are based only on price movement and do not consider time. There is an x-axis, but it doesn't stretch evenly across the chart.
The intention of our price chart template collection is to provide useful document templates to you, in order to draft professional documents by yourself. Easy to use documents in Word, PPT, XLS, the format for Strategy & Planning, policy making, Management, Organization, Performance, etc
AllBusinessTemplates.com understands the importance of strong communication in order to achieve your personal and company objectives, therefore we collected lots of quality price chart templates for your convenience.


