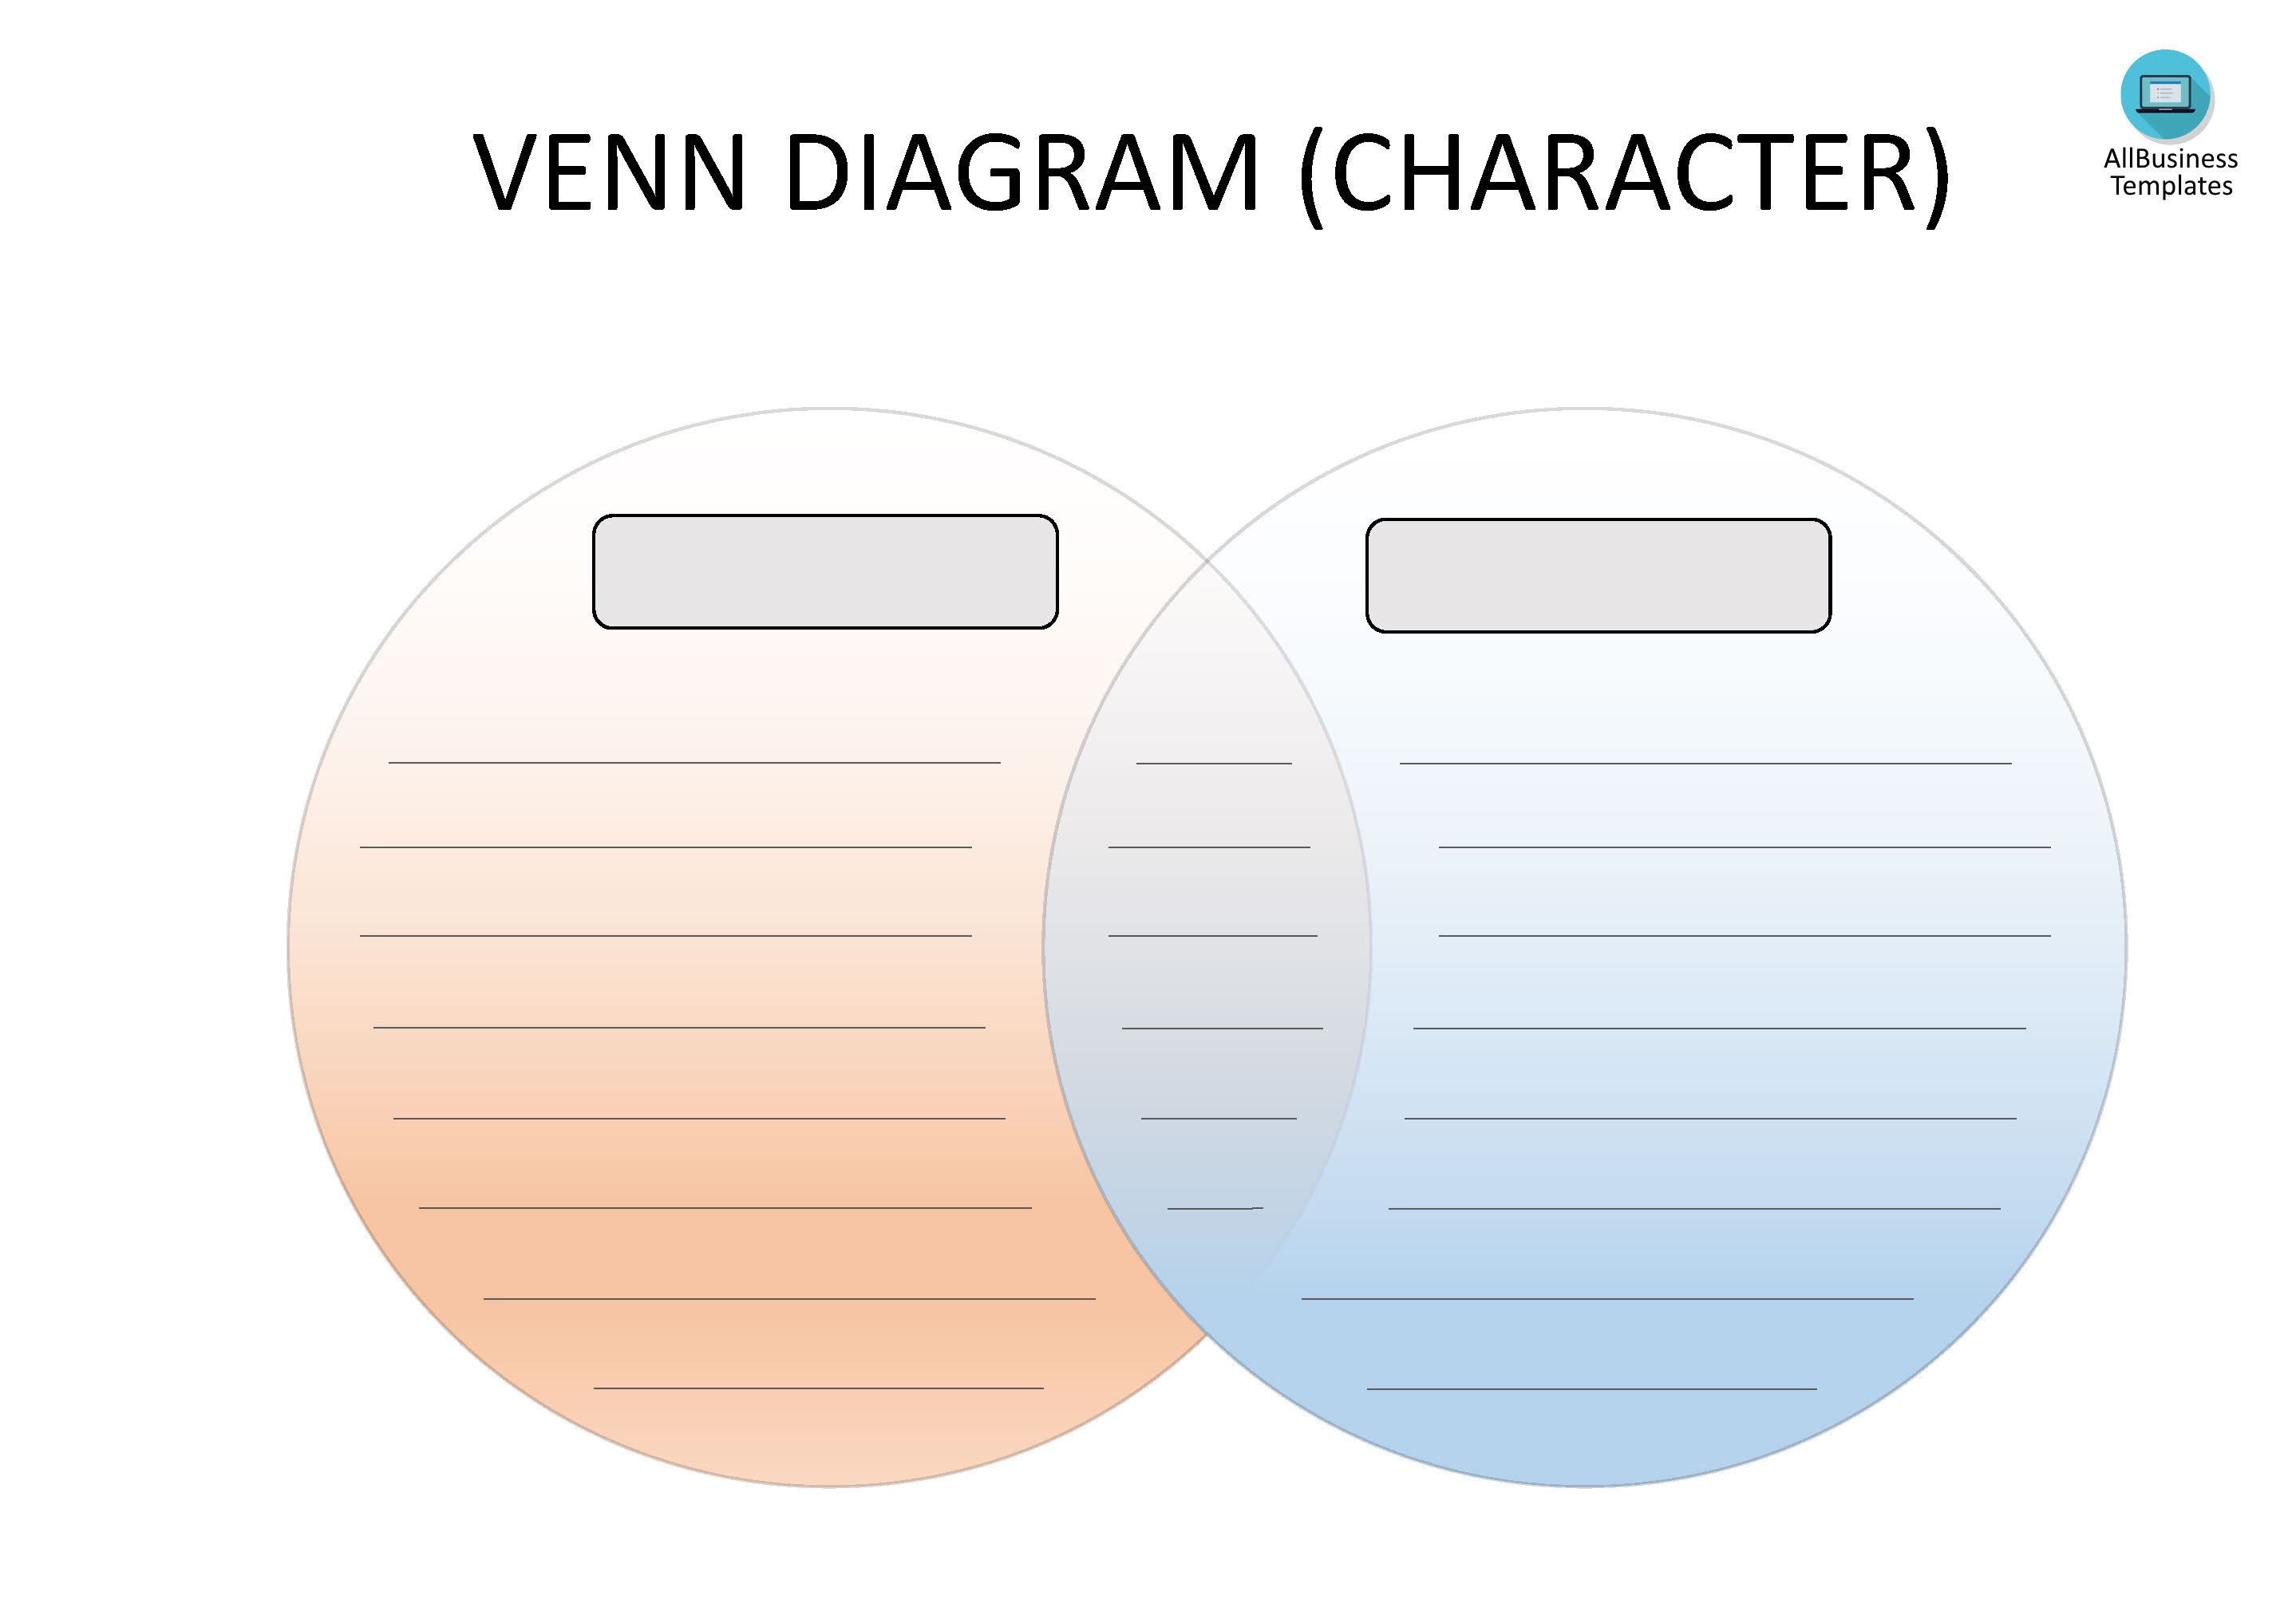
Venn Diagram Organizer

Speichern, ausfüllen, drucken, fertig!
Where you searching for a diagram template to compare and contrast? Make your visuals step up by downloading our customizable Venn Diagram template, where you can adjust every detail and visual aspect according to your preferences.
Verfügbare Gratis-Dateiformate:
.pptx- Dieses Dokument wurde von einem Professional zertifiziert
- 100% anpassbar
Business Unternehmen Life Privat Education Bildung PowerPoint Power Point circle Kreis how to make a venn diagram wie man ein venn diagramm erstellt venn Venn venn circle Venn Kreis ppt pptx simple powerpoint templates Einfache PowerPoint-Vorlagen powerpoint template PowerPoint-Vorlage best PPT templates free download besten PPT-Vorlagen zum kostenlosen Download professional PowerPoint templates free download Professionelle PowerPoint-Vorlagen zum kostenlosen Download
How do you use the Venn Diagram Organizer template? You have everything in mind, and just need a nice instrument to work it out? Our sample template will helps you easily visualize relationships between two or more things. They are often used in brainstorming and problem-solving activities, as well as to explore similarities and differences between two or more items. Download this Venn diagram organizer template (PowerPoint) now!
A Venn diagram organizer is a tool or template that helps individuals create, structure, and organize information using Venn diagrams. It provides a framework for visually representing the relationships between sets and their elements. The organizer typically includes circles or other shapes that users can fill in with text or other information to illustrate the intersection and differences between sets.
Key features of a Venn diagram organizer may include:
- Circles or Shapes: The primary elements of the organizer are circles (or other shapes) that represent sets. The arrangement and overlap of these shapes depict the relationships between the sets.
- Labels: Each circle is labeled with the name of the corresponding set. Labels provide context and help users understand the content of each set.
- Intersecting Areas: The overlapping regions of the circles indicate the common elements shared by the sets. Users can add text or labels to these areas to describe the shared characteristics or elements.
- Blank Spaces: The organizer includes blank spaces inside and outside the circles where users can input information. This allows for customization based on the specific data or concepts being compared.
- Guidelines or Lining: Some organizers may include guidelines or lining to assist users in creating neat and well-organized diagrams.
A Venn diagram organizer can be used in various contexts, such as education, problem-solving, data analysis, and brainstorming. It helps individuals visually organize information, identify patterns, and communicate relationships between different groups or categories.
In a Venn diagram:
- Each circle or shape represents a set or category, and the elements belonging to that set are placed within the boundary of the circle.
- The overlapping regions between the circles represent the common elements shared by the sets that overlap.
- The non-overlapping areas within each circle represent the elements unique to that specific set.
Venn diagrams help to visually clarify concepts like similarities, differences, and relationships among multiple categories. They are often used in fields such as mathematics, logic, statistics, and various academic disciplines to present complex ideas clearly and concisely.
This Venn Diagram template in MS PowerPoint will help you structure your thoughts on every detail in a professional way! It provides for a clear comparison between 2 units, options, or persons. You can find many different types of Venn Diagrams. Just pick the one you consider to be the most suitable for your comparison.
As mentioned, this diagram template helps you to make the right comparison, and through that, enable yourself to become more successful in your, education, work, and business.
Download this Venn Diagram PPT directly. Fast, safe and easy!
HAFTUNGSAUSSCHLUSS
Nichts auf dieser Website gilt als Rechtsberatung und kein Mandatsverhältnis wird hergestellt.
Wenn Sie Fragen oder Anmerkungen haben, können Sie sie gerne unten veröffentlichen.
