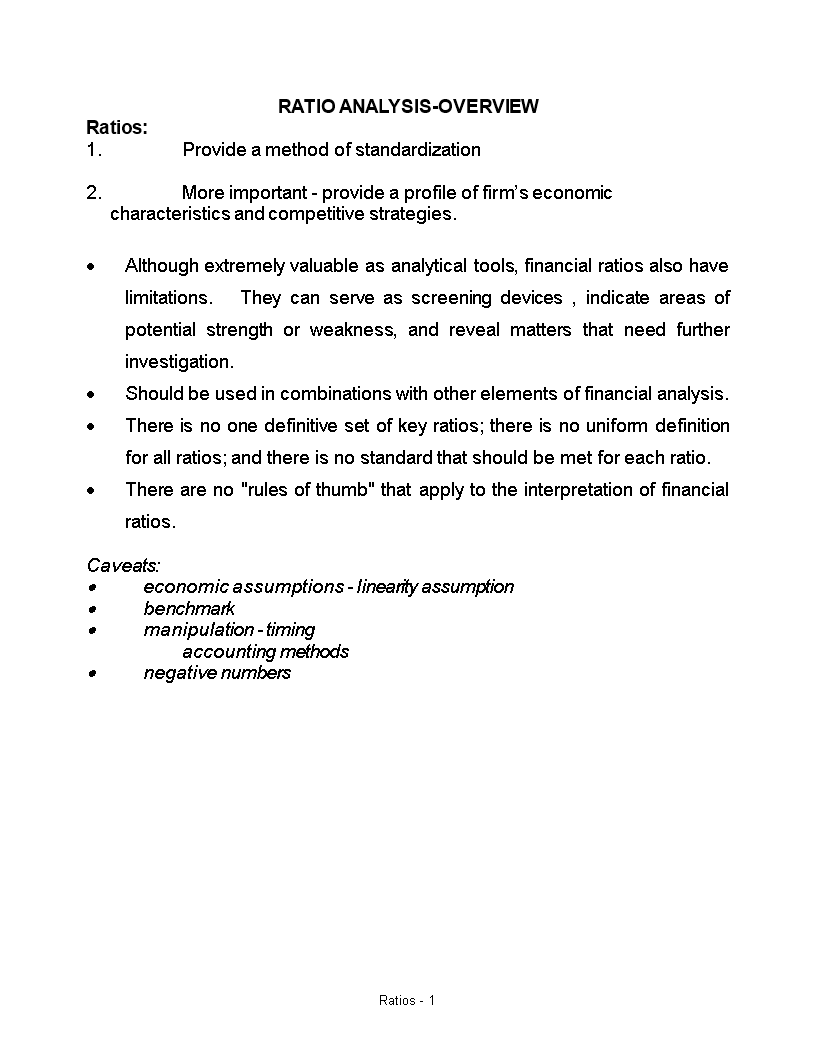
Common Size Financial Statement Analysis
Sponsored Link免费模板 保存,填空,打印,三步搞定!

Download Common Size Financial Statement Analysis
微软的词 (.doc)免费文件转换
- 本文档已通过专业认证
- 100%可定制
- 这是一个数字下载 (111 kB)
- 语: English
Sponsored Link
Whether you manage the finances at your work or at home, adequate communication is essential. Accurately keeping track of financial data is not only critical for running the day-to-day operations of your small business, but it is also important when seeking funds from investors or lenders to grow your business to the next level. Having correct and accurate information exchange, enables and ensures you, you are able to make the right decisions. For those working in Finance, it's important to be accurate and always double-check every detail.
Feel free to download our basic or advanced finance templates, they are intuitive and in several kinds of formats, such as PDF, WORD, PPT, XLS (Excel includes formulas and can calculate sums automatically), etc.
Using this Common Size Financial Statement Analysis financial template guarantees that you will save time, cost and efforts and enables you to reach the next level of success in your project, education, work, and business!
Download this professional Common Size Financial Statement Analysis template now!
Looking for more? Our collection of financial documents, templates, forms, and spreadsheets includes templates designed specifically for small business owners, private individuals, or Finance Staff. Find financial projections to calculate your startup expenses, payroll costs, sales forecast, cash flow, income statement, balance sheet, break-even analysis, financial ratios, cost of goods sold, amortization and depreciation for your company. These financial templates also work with OpenOffice and Google Spreadsheets, so if you are operating your business on a very tight budget, hopefully, you'll be able to make these financial templates work for you as well.
DISCLAIMER
Nothing on this site shall be considered legal advice and no attorney-client relationship is established.
发表评论。 如果您有任何问题或意见,请随时在下面发布

