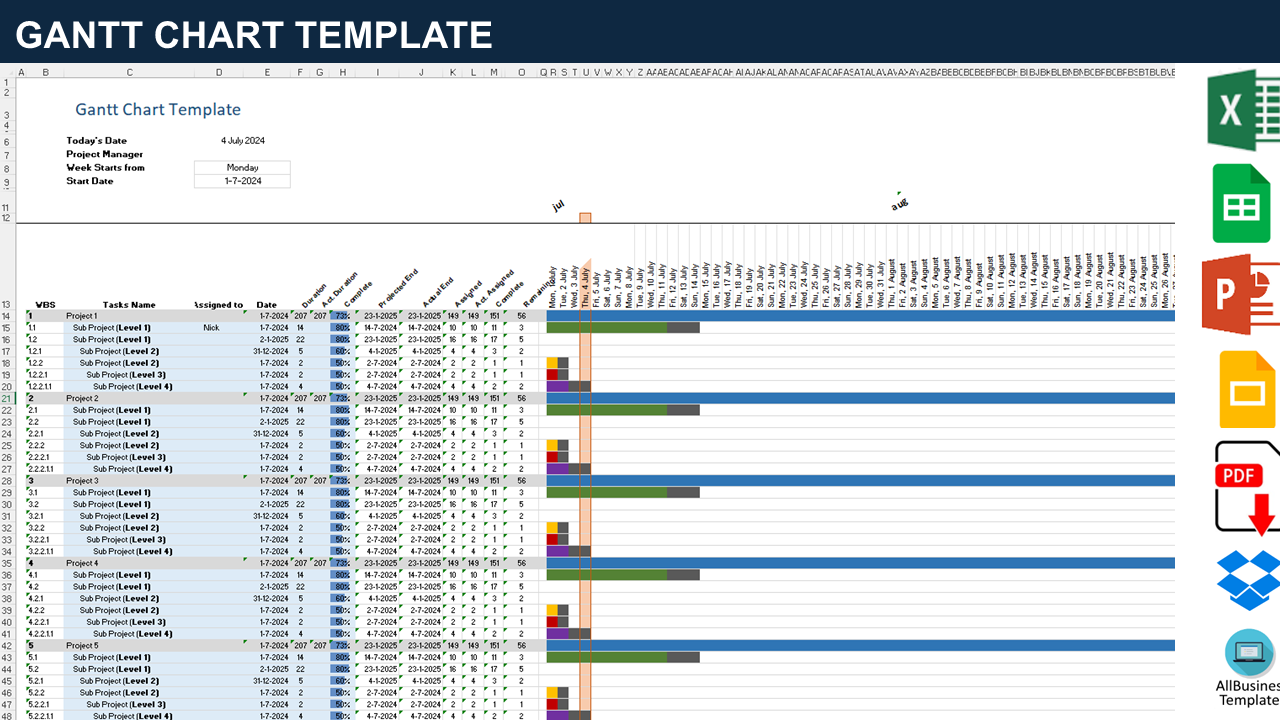
Project Gantt Chart Excel Template
Sponsored Link高级模板 保存,填空,打印,三步搞定!

下载 下载 What is a Gantt chart and why is it important? How to create a Gantt Chart planning and WBS in MS Excel? this Gantt Chart Excel which is a great way to visualize a project's timeline and tasks.
只有今天: USD 3.99
点击购买

可用的免费文件格式:
微软电子表格 (.xlsx)- 本文档已通过专业认证
- 100%可定制
- 这是一个数字下载 (101.03 kB)
- 语: English
- 付款完成后,您将收到包含该文件的电子邮件。
Sponsored Link
What is a Gantt chart and why is it important? How to create a Gantt Chart planning in MS Excel?
A Gantt Chart in Excel or Google Docs is a great way to visualize a project's timeline and tasks. It can help to identify potential issues and risks, as well as manage resources effectively. Download this professional Project Gantt Chart in Excel template now!
A Project Gantt Chart in Excel Template is a pre-designed Excel file that includes a framework for creating Gantt Charts easily. It typically comes with placeholders and formulas that automatically generate the Gantt Chart based on the data you input. These templates save time and effort, providing a convenient starting point for project managers and teams to create visual project schedules.
How to create a Gantt chart planning in MS Excel?
Creating a Gantt Chart in Microsoft Excel involves the following steps:
- Data Preparation:
- Column A: List tasks.
- Column B: Enter start dates.
- Column C: Enter task durations.
- Insert a Stacked Bar Chart:
- Highlight data (excluding headers).
- Go to the "Insert" tab.
- Select "Bar Chart" and choose "Stacked Bar."
- Format the Gantt Chart:
- Right-click on the chart, and choose "Format Data Series."
- Adjust the gap width to make the bars thinner.
- Change colors for better visibility.
- Add Task Completion:
- Insert a new column for task completion (percentage).
- Add completion data for each task.
- Format Task Completion:
- Change the bar color based on completion.
- Right-click, and choose "Format Data Series."
- Adjust Dates:
- Fine-tune dates on the chart if needed.
- Add Milestones:
- Insert another data series for milestones.
- Format as desired (e.g., diamonds).
- Final Adjustments:
- Label axes, and add a title.
- Customize chart appearance.
To use a Project Gantt Chart in Excel Template:
- Download this Gantt Chart template (or open in Google Docs);
- Input your project data into the designated areas;
- The Gantt Chart will automatically update based on the entered information;
- Customize the chart as needed, adjusting colors, formatting, and other details;
- Save and share the updated Gantt Chart with your team.
Excel templates can be a great resource for project managers, offering a standardized and efficient way to create Gantt Charts without starting from scratch. Many project management tools and websites also provide downloadable Gantt Chart templates for Excel that you can use for various types of projects. Feel free to download this Gantt Chart Template worksheet in Excel, or simply browse through our website to find other basic or advanced Gantt Planner designs. This Gantt Planner is intuitive and available in several kinds of formats, such as PDF, WORD, and XLSX. This Excel Xlsx file also includes all the necessary formulas and can calculate the time based on the dates you input for the activities automatically.
Using this Planning template guarantees that you will save time, cost, and effort and makes you more successful in your project, work, and business!
Download this project Gantt Chart Planning template now or open it in Google Docs! Managing your Projects with an effective Gantt Chart and a well designed Work Breakdown Structure was never easier!
DISCLAIMER
Nothing on this site shall be considered legal advice and no attorney-client relationship is established.
发表评论。 如果您有任何问题或意见,请随时在下面发布
相关文件
Sponsored Link
