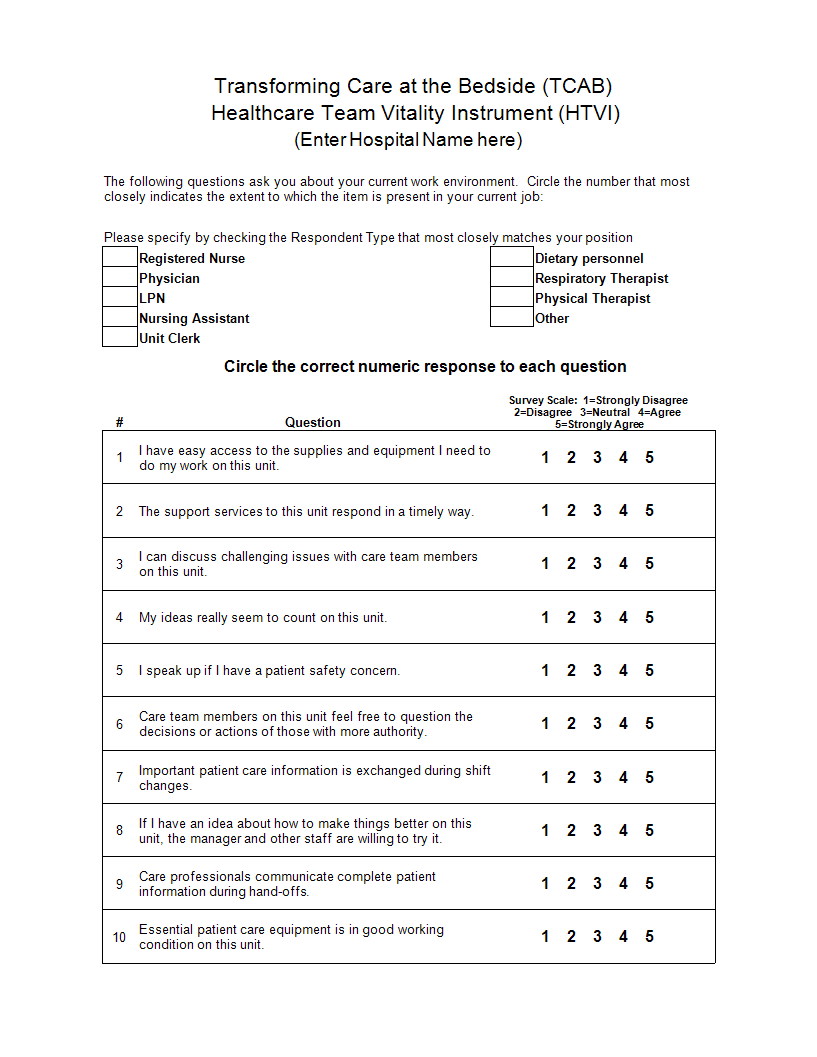
Likert Scale in Excel
Sponsored Link免费模板 保存,填空,打印,三步搞定!

Download Likert Scale in Excel
微软电子表格 (.xlsx)- 本文档已通过专业认证
- 100%可定制
- 这是一个数字下载 (105.85 kB)
- 语: English
Sponsored Link
How to create and to test a Likert scale in Excel? An easy way is by downloading this Multiple Choice Likert Scale in MS Excel template now!
Creating and testing a Likert scale in Excel involves several steps, including setting up the scale, designing the survey, and analyzing the results. Here's a detailed guide on how to do this:
Step 1: Setting Up the Likert Scale (5 options of multiple choice questions)
Define the Scale:
Decide on the number of points in your Likert scale (e.g., 5-point, 7-point).
Example for a 5-point scale:
1: Strongly Disagree
2: Disagree
3: Neutral
4: Agree
5: Strongly Agree
Create the Options:
List these options in a range of cells for easy reference.
Step 2: Designing the Survey
Create Survey Questions:
In column A, list your survey questions.
Example: A1: "How satisfied are you with our service?"
Insert Dropdowns:
For each question, add a dropdown menu for responses.
Select the cell next to the question (e.g., B1).
Go to the Data tab and select Data Validation.
In the Data Validation dialog box, choose List in the Allow field.
In the Source field, enter the range containing your Likert scale options (e.g., $D$1:$D$5).
Click OK.
Copy Dropdowns:
Copy the dropdown cell (B1) and paste it next to all survey questions.
Step 3: Testing the Likert Scale
Input Responses:
Respond to the survey by selecting options from the dropdown menus.
Analyze the Responses:
Create a summary table to analyze the results.
List each question and use Excel functions to calculate the average, count, and other statistics for each question.
Step 4: Detailed Analysis
Calculate Averages:
Use the AVERAGE function to find the average score for each question.
Example: =AVERAGE(B2:B10)
Count Responses:
Use the COUNTIF function to count the number of responses for each option.
Example: =COUNTIF(B2:B10, "1") for counting "Strongly Disagree".
Visualize Data:
Create charts (e.g., bar charts, pie charts) to visualize the distribution of responses.
Highlight the data range and select a chart type from the Insert tab.
Example Layout
Question Response
How satisfied are you with our service? [Dropdown]
How likely are you to recommend us? [Dropdown]
Summary Table
Question Average Strongly Disagree Disagree Neutral Agree Strongly Agree
How satisfied are you with our service? 1 2 3 4 5
By following these steps, you can create and test a Likert scale in Excel, allowing you to gather and analyze survey data effectively.
This Excel spreadsheet is an interactive digital worksheet in tabular form and designed to organize information and perform calculations with scalable entries. It's not a matter of being a beginner or professional, from all over the world, are now using spreadsheets to create tables, calculations, comparisons, overviews, etc for any personal or business need.
Download this Likert Scale in excel Excel spreadsheet directly to your computer, open it, modify it or print it directly. You'll see it is a great way to increase your productivity and to bring your task to a successful ending!
DISCLAIMER
Nothing on this site shall be considered legal advice and no attorney-client relationship is established.
发表评论。 如果您有任何问题或意见,请随时在下面发布
相关文件
Sponsored Link

