Measurement Process Flow Chart
Sponsored Link免费模板 保存,填空,打印,三步搞定!

Download Measurement Process Flow Chart
Adobe PDF (.pdf)- 本文档已通过专业认证
- 100%可定制
- 这是一个数字下载 (496.08 kB)
- 语: English
Sponsored Link
How to draft a Measurement Process Flow Chart? An easy way to start completing your document is to download this Measurement Process Flow Chart template now!
Every day brings new projects, emails, documents, and task lists, and often it is not that different from the work you have done before. Many of our day-to-day tasks are similar to something we have done before. Don't reinvent the wheel every time you start to work on something new!
Instead, we provide this standardized Measurement Process Flow Chart template with text and formatting as a starting point to help professionalize the way you are working. Our private, business and legal document templates are regularly screened by professionals. If time or quality is of the essence, this ready-made template can help you to save time and to focus on the topics that really matter!
Using this document template guarantees you will save time, cost and efforts! It comes in Microsoft Office format, is ready to be tailored to your personal needs. Completing your document has never been easier!
Download this Measurement Process Flow Chart template now for your own benefit!
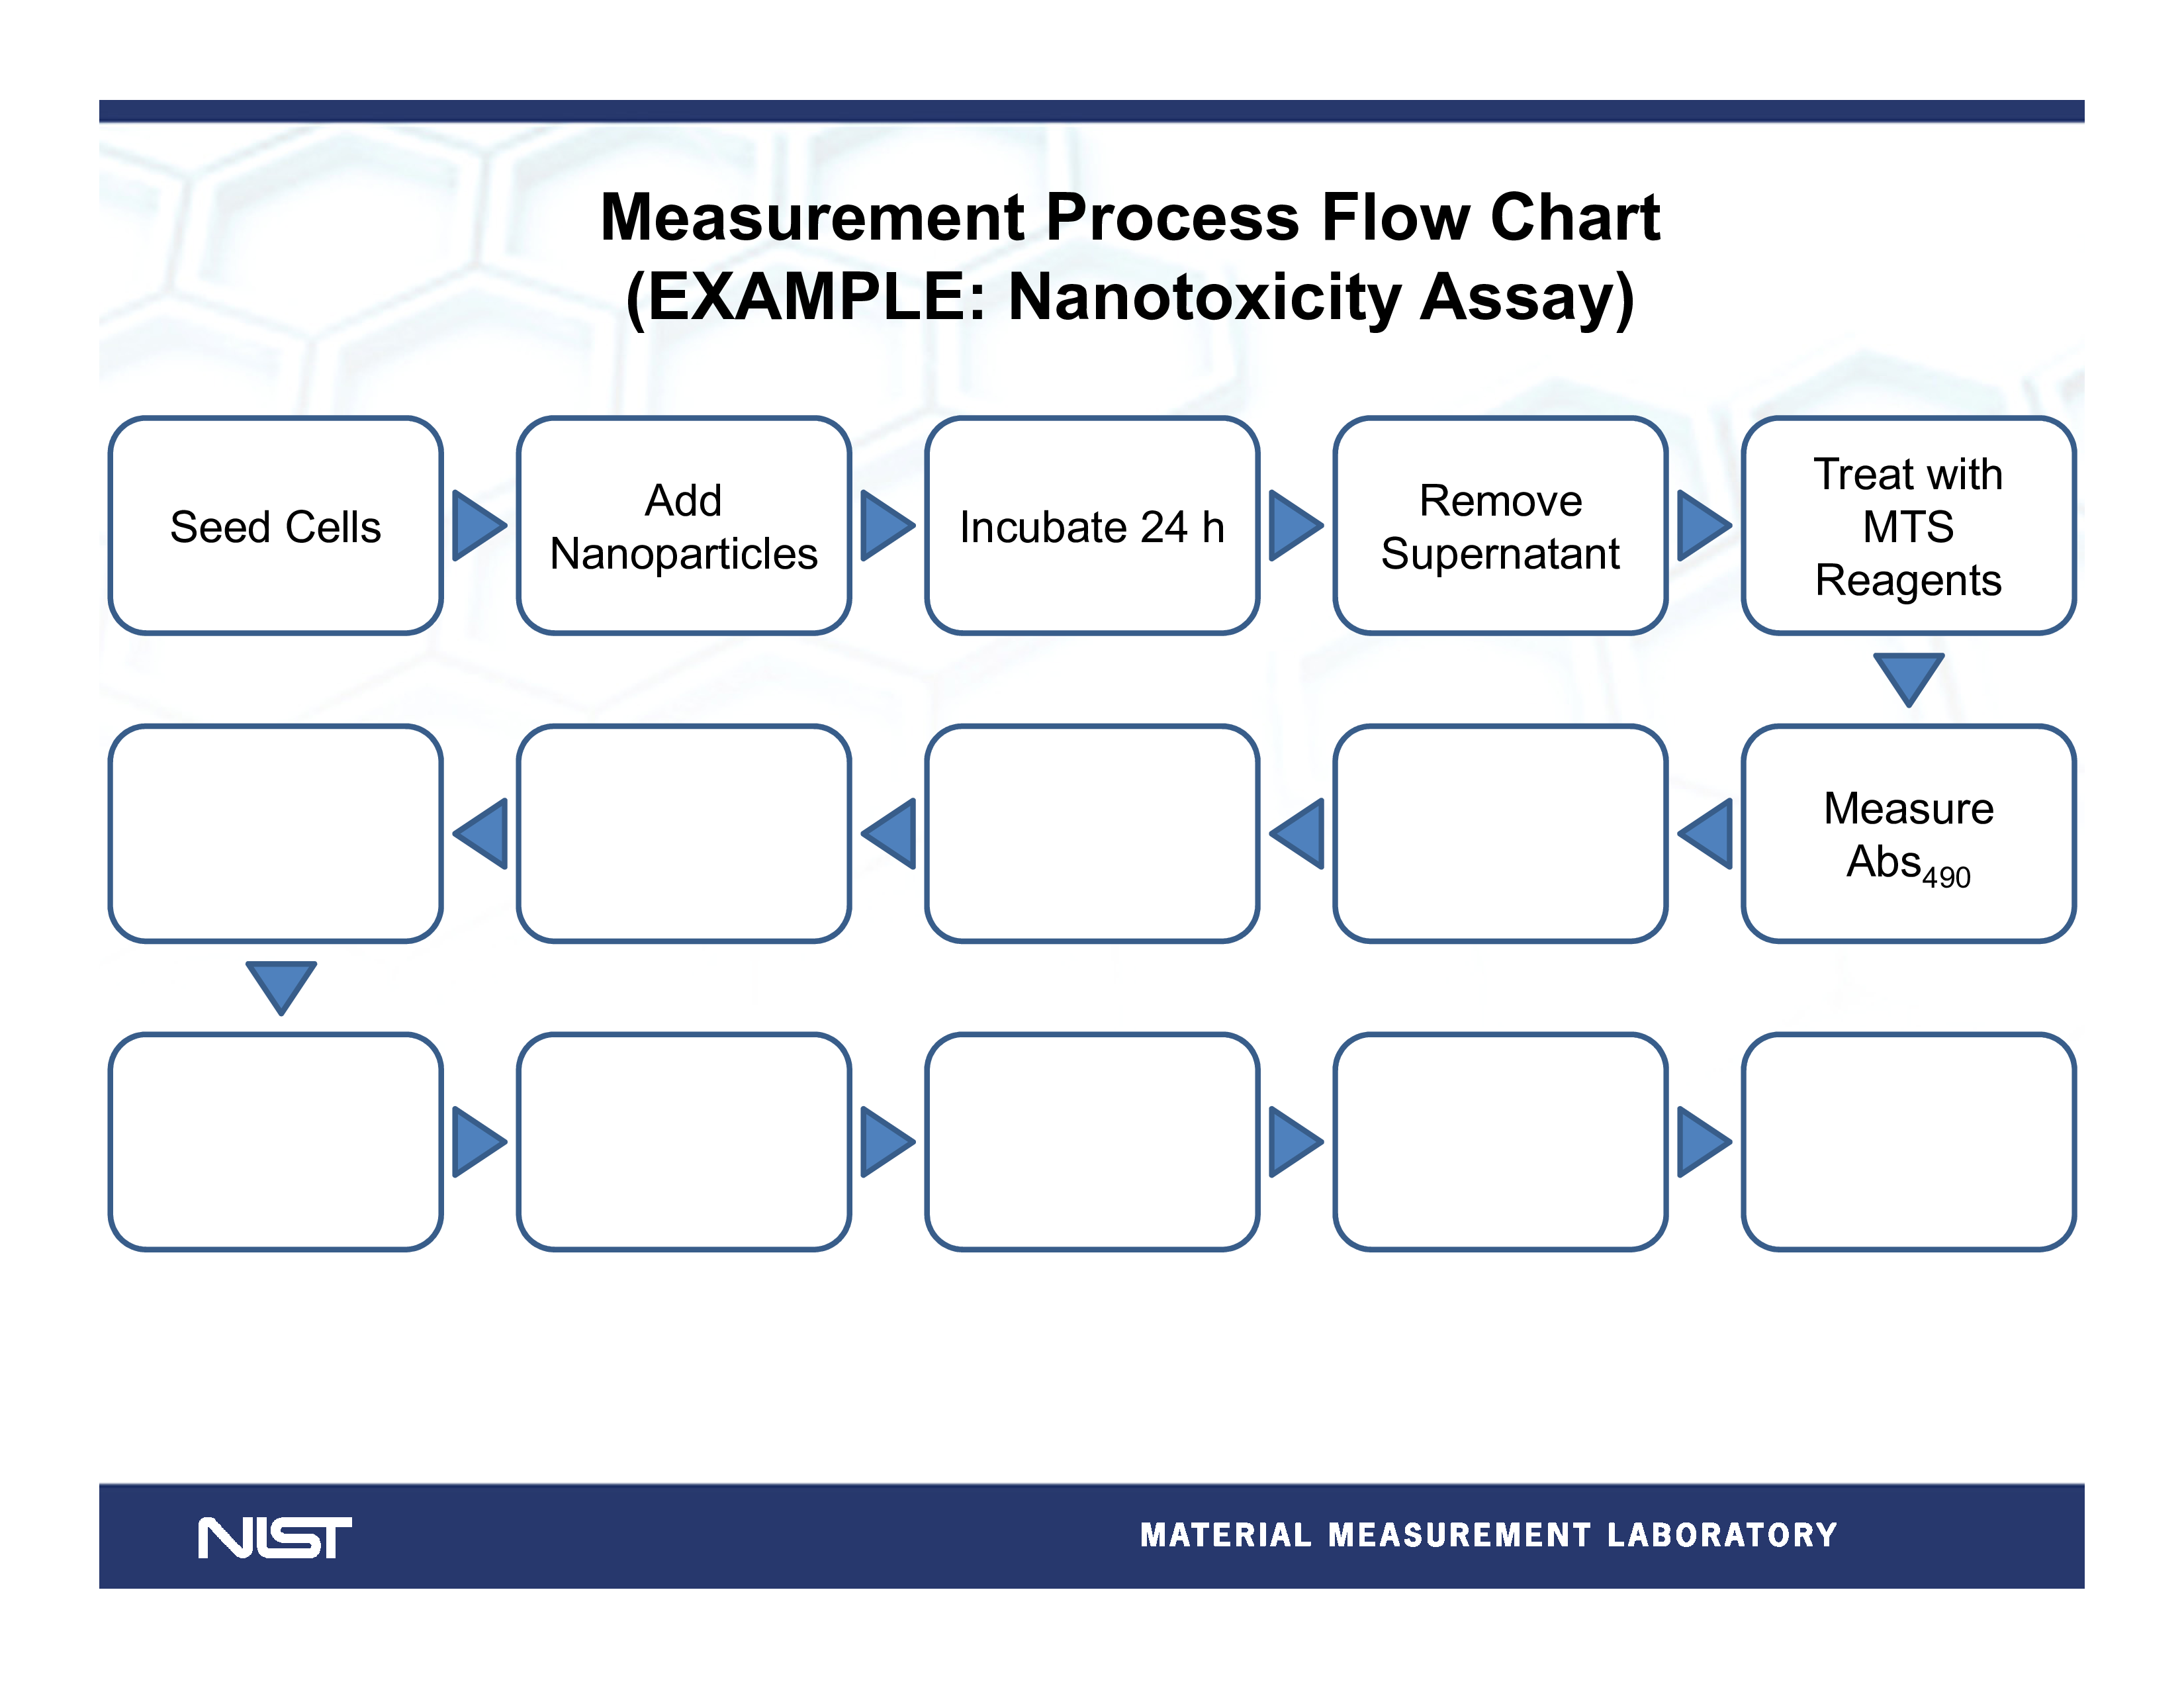
Measurement Process Flow Chart (EXAMPLE: Nanotoxicity Assay) Seed Cells Add Nanoparticles Incubate 24 h Remove Supernatant Treat with MTS Reagents Measure Abs490 Measurement Process Flow Chart (TEMPLATE) Measurement Controls (TEMPLATE) Variables/Factors EXAMPLE: Nanotoxicity assay: Variable: Cell toxicity response Why an Issue Cell response varies due to many factors (passage, incorrect seeding, variability in medium, contamination, etc.) Control Experiment /Approach Add cadmium sulfate to cells to establish a reproducible “toxic” response in the assay Reference Material Cadmium sulfate Ishikawa Diagram (EXAMPLE: Nanotoxicity Assay) Rösslein M, Elliott JT, Salit M, Petersen EJ, Hirsch C, Krug HF, Wick P..
DISCLAIMER
Nothing on this site shall be considered legal advice and no attorney-client relationship is established.
发表评论。 如果您有任何问题或意见,请随时在下面发布
Sponsored Link

