Turtle Chart
Sponsored Link免费模板 保存,填空,打印,三步搞定!

What is a Turtle Chart and how to make one?
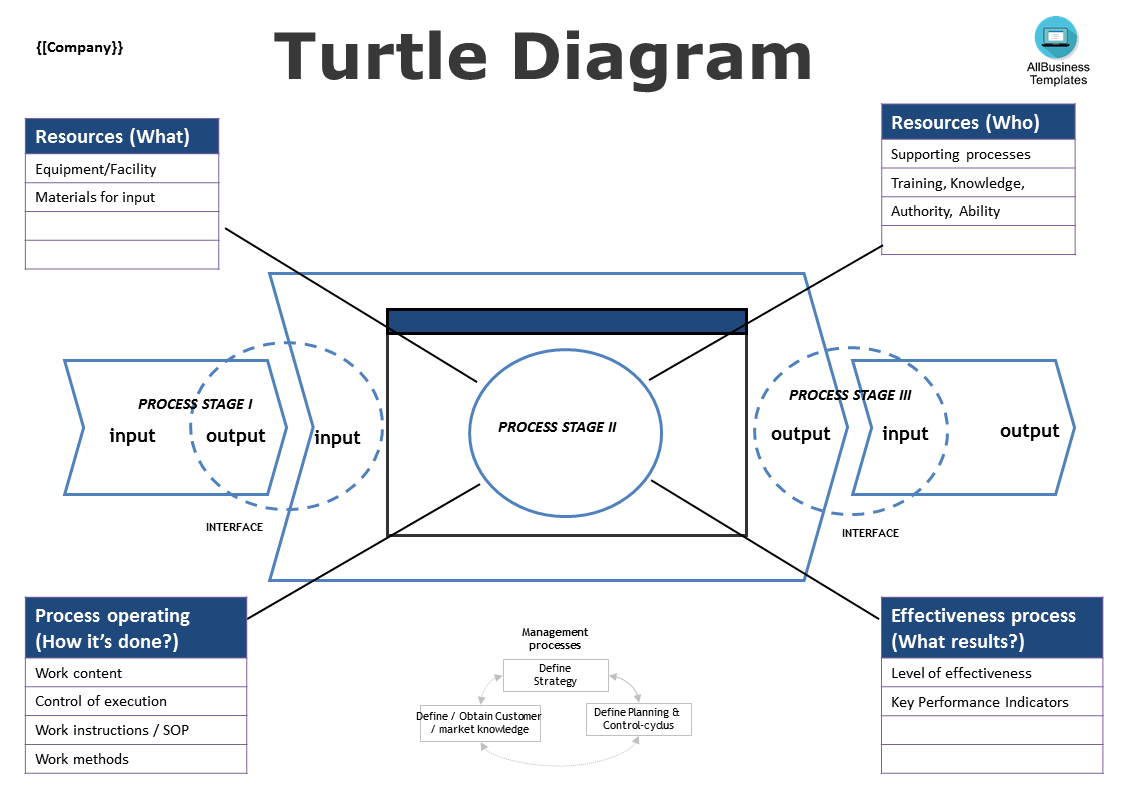
Have a look at this Turtle Chart, also called Turtle Diagram. The name is derived from the fact the diagram shows similarities of that of the body, head, feet, and tail of the turtle. A turtle diagram is often used in Quality Manuals to show the process input, throughput and output of a few related processes. A Turtle Chart is a visualization tool that can be used to detail, in a very precise manner, all of the components and relations of any given process within your organization.
The Turtle Chart is commonly found in documents created based on international standards and provides an example that shows how to visualize processes and procedures, as a part of your Quality Management System (QMS).
The power of visualization is that it makes the complexity of your organization and its individual processes clearer and easy to explain to management and staff. In this simplicity lies it's power, why its useful for your organization. It will support and improve the existing Quality Management System works and controls that are already in place to manage each process. It demonstrates the commitment to meeting your customer expectations’ by delivering quality products and/or services.
By implementing Turtle charts for your primary and supportive business processes, you will improve your Quality Management System or compliance with QMS systems such as the new ISO 9001: 2015. Also in Risk management, the chart plays an important role. It is best to link the determination of measurement points to the result of the requested risk analysis. If you know what the most critical points in your processes are, it is logical that you follow them up as a process indicator. The following elements can be clarified in this:
- a responsible person who carries out the process;
- important instructions and knowledge to carry out the process;
- data that is needed to carry out the process;
- resources required to carry out the process;
- the location where the process is carried out;
- the "trigger" or trigger that generates the process;
- contributions for achieving the objective of the process;
- risks that the process generates;
- information that the process generates;
- contribution to the realization of the product of the process;
- output or status of the process.
Finally, monitoring, measuring, directing, and managing processes is important. But it should not be a higher priority than following up on people.
Suggestion: Don't overdo it with formal, purely numerical measurements. Also pay attention to aspects that are not or less measurable that contribute to a good feeling, good cooperation, and a good customer result.
Suggestion: A turtle diagram (turtle diagram) shows on one page all contextual aspects of a process: input, place, actors, means (including documentation and procedures), goals, output, final status. As a starting point for process analysis and improvement, it is a handy tool.
Download this Turtle Chart as a PowerPoint slide now and you will find out it’s very helpful for your company to improve the quality level by measuring, monitoring, and reporting about the performance of the business processes and gradually improve the company output.
Other primary quality control tools, such as checklists, fishbone diagrams, control charts, manuals, charts, reports, can be found here: Quality Management Templates.
DISCLAIMER
Nothing on this site shall be considered legal advice and no attorney-client relationship is established.
发表评论。 如果您有任何问题或意见,请随时在下面发布
相关文件
Sponsored Link


