Gantt Chart
Sponsored Link免费模板 保存,填空,打印,三步搞定!

Download Gantt Chart
Adobe PDF (.pdf)- 本文档已通过专业认证
- 100%可定制
- 这是一个数字下载 (19.26 kB)
- 语: English
Sponsored Link
How to draft a Gantt Chart? In what way does a Gantt chart represent time? Our templates are easy to use and can be customized to fit your exact requirements. You can also share your Gantt Chart with team members to keep them informed and updated. An easy way to start completing your document is to download this Gantt Chart template now!
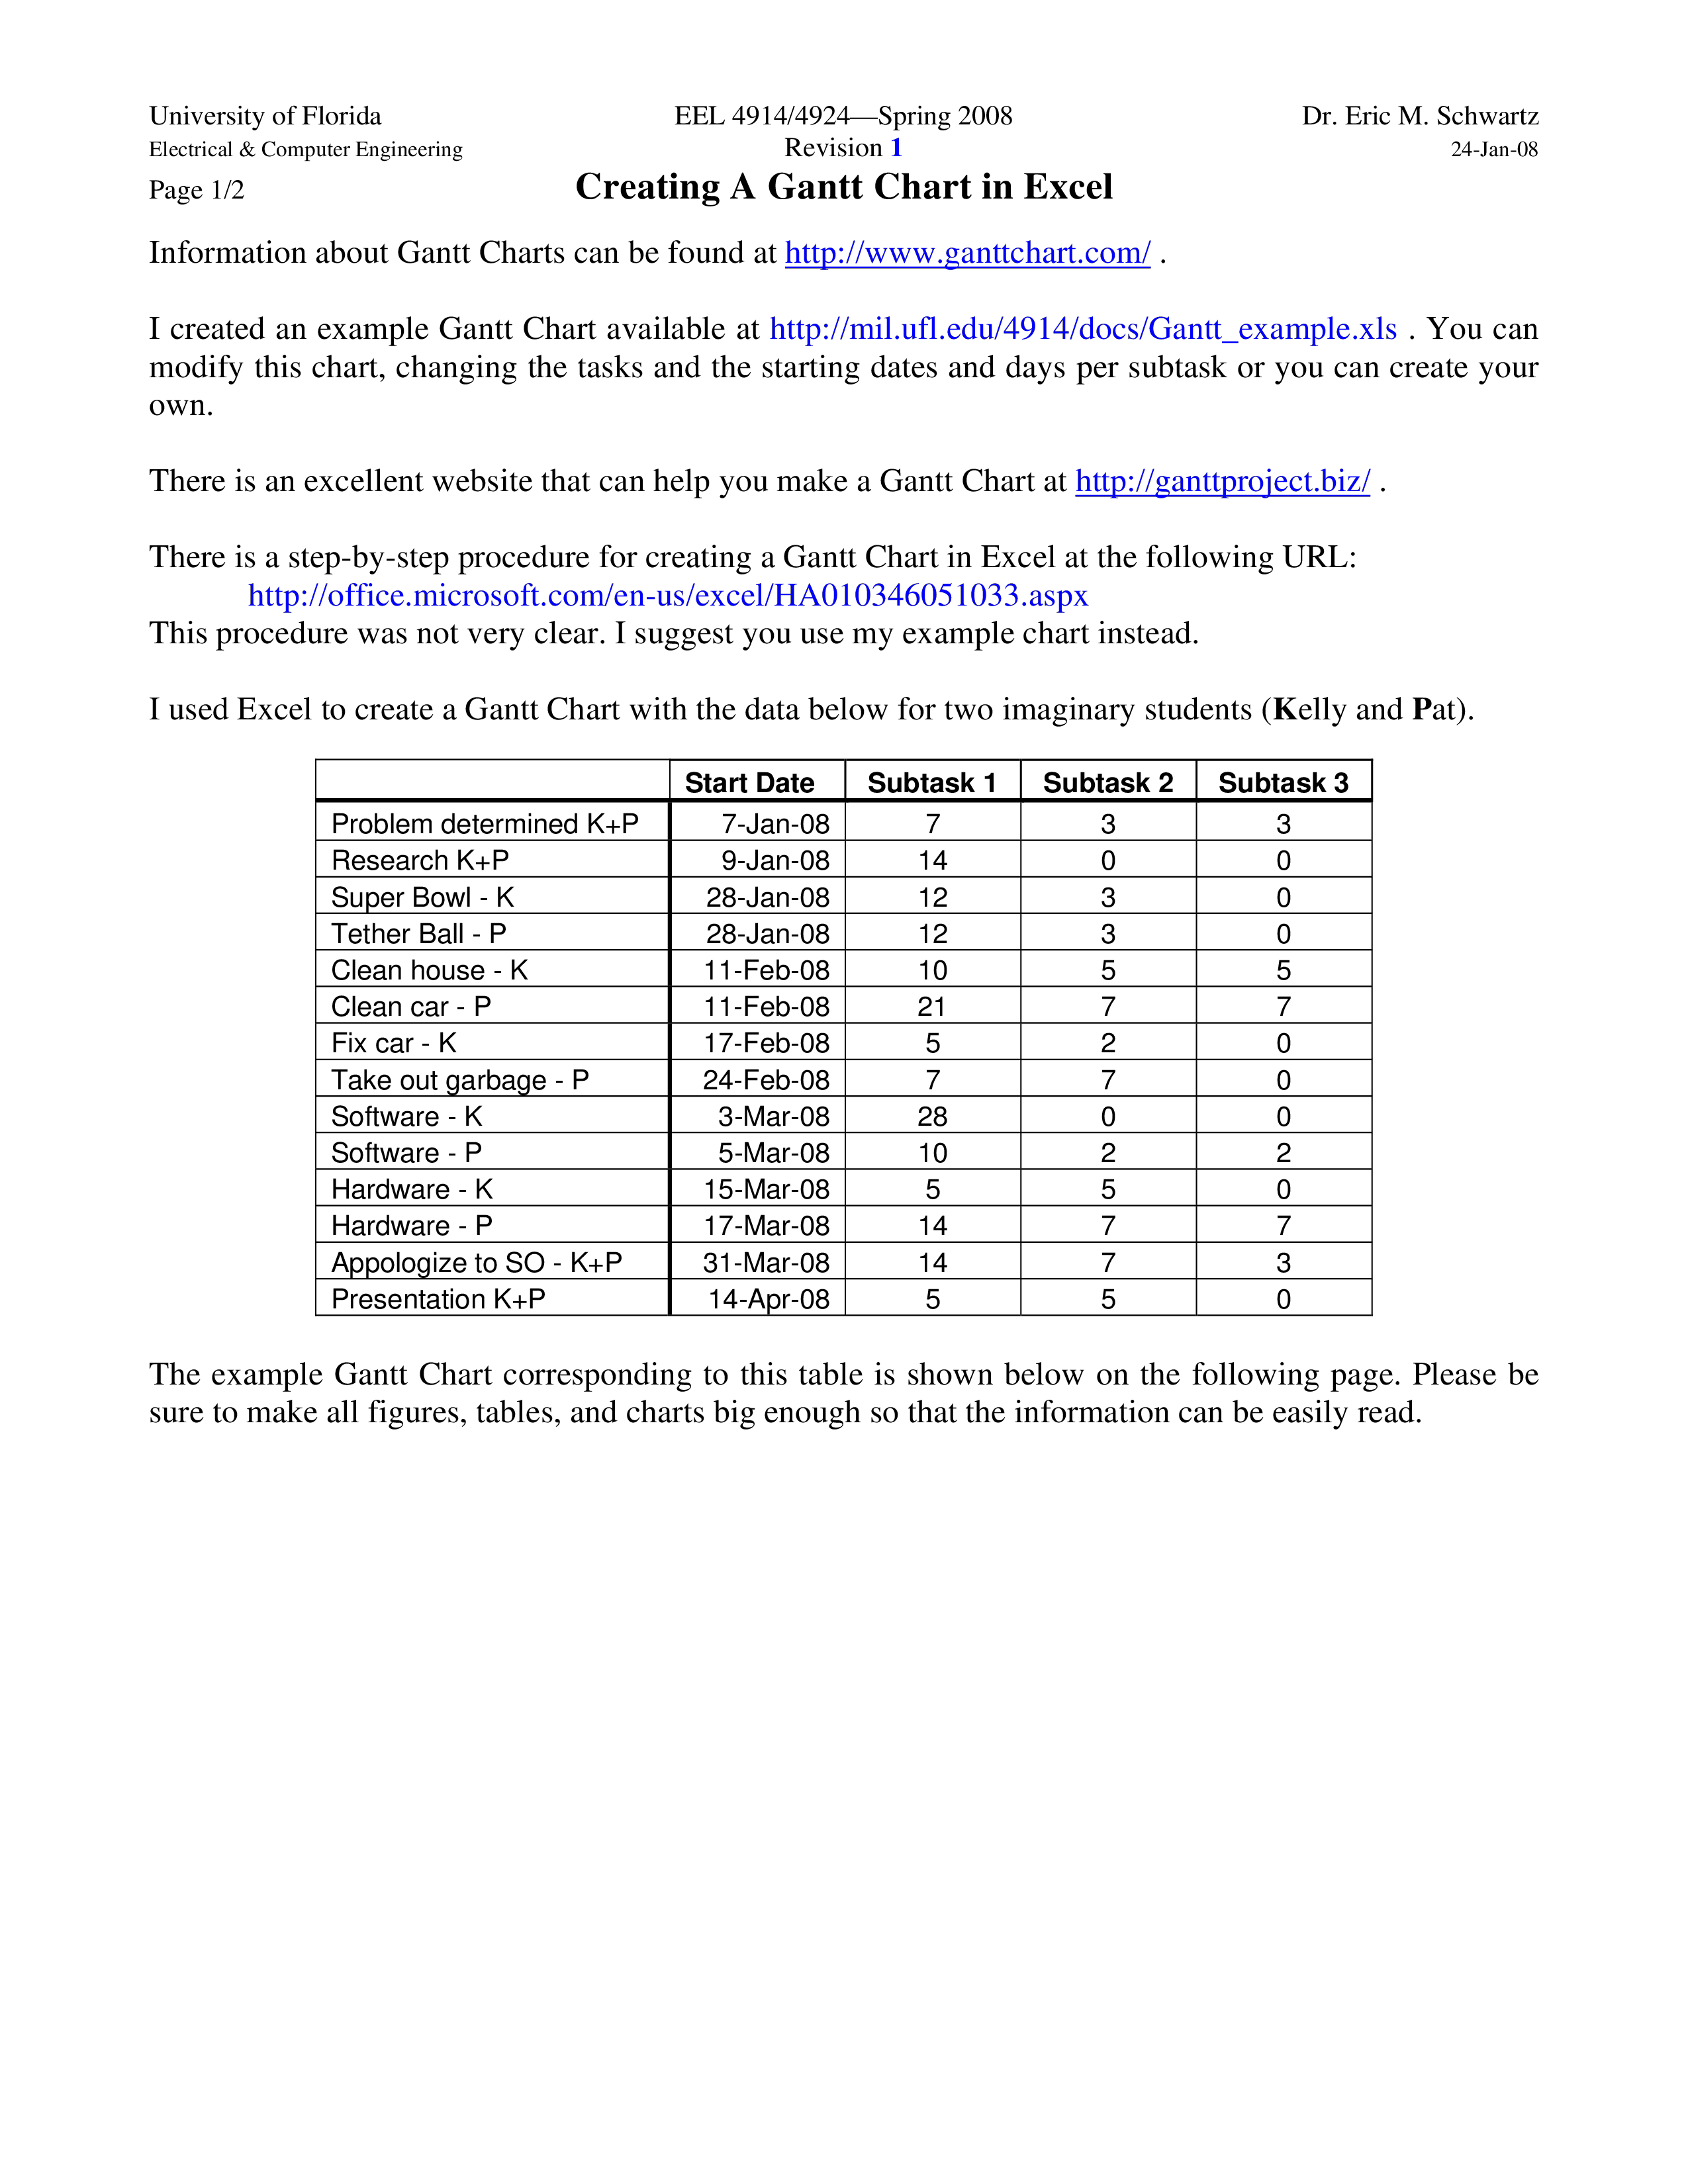
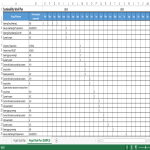
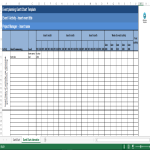
A Gantt Chart is a visual representation of a project schedule that illustrates the start and finish dates of various elements of a project. It provides a graphical view of tasks, their durations, and the dependencies between them. The chart is named after Henry L. Gantt, who developed the technique in the 1910s.
Here are the key elements and meanings associated with a Gantt Chart:
- Task List: The Gantt Chart typically includes a list of tasks or activities required to complete a project. Each task is represented as a horizontal bar on the chart.
- Timeline: The chart includes a timeline, usually depicted along the top or bottom, representing the overall time frame of the project. The timeline is divided into increments such as days, weeks, or months.
- Bars: Each task is represented by a horizontal bar that spans from the task's start date to its end date. The length of the bar corresponds to the duration of the task. The position of the bar on the timeline indicates when the task is scheduled to occur.
- Dependencies: Gantt Charts often show dependencies between tasks. If one task must be completed before another can begin, this relationship is depicted by the positioning of the bars and, in some cases, connecting lines.
- Milestones: Important points or achievements in the project, known as milestones, may be highlighted on the Gantt Chart. Milestones are typically represented by specific symbols or markers.
- Progress Tracking: As the project progresses, the Gantt Chart can be updated to reflect the actual start and finish dates of tasks. This allows for real-time tracking of project progress.
- Resource Allocation: Gantt Charts can be used to visualize the allocation of resources over time. This helps project managers ensure that resources are utilized efficiently throughout the project.
The Gantt Chart is a valuable tool for project management because it provides a visual and easy-to-understand representation of the project schedule. It aids in planning, scheduling, coordination, and communication among project team members and stakeholders. Gantt Charts are widely used in various industries to manage projects of different sizes and complexities.
Every day brings new projects, emails, documents, and task lists, and often it is not that different from the work you have done before. Many of our day-to-day tasks are similar to something we have done before. Don't reinvent the wheel every time you start to work on something new!
Instead, we provide this standardized Gantt Chart template with text and formatting as a starting point to help professionalize the way you are working. Our private, business and legal document templates are regularly screened by professionals. If time or quality is of the essence, this ready-made template can help you to save time and to focus on the topics that really matter!
Using this document template guarantees you will save time, cost and efforts! It comes in Microsoft Office format, is ready to be tailored to your personal needs. Completing your document has never been easier!
Download this Gantt Chart template now for your own benefit!
DISCLAIMER
Nothing on this site shall be considered legal advice and no attorney-client relationship is established.
发表评论。 如果您有任何问题或意见,请随时在下面发布
相关文件
Sponsored Link


