Project Management Gantt Chart Excel
Sponsored Link免费模板 保存,填空,打印,三步搞定!

Download Project Management Gantt Chart Excel
微软电子表格 (.xlsx)- 本文档已通过专业认证
- 100%可定制
- 这是一个数字下载 (653.51 kB)
- 语: English
Sponsored Link
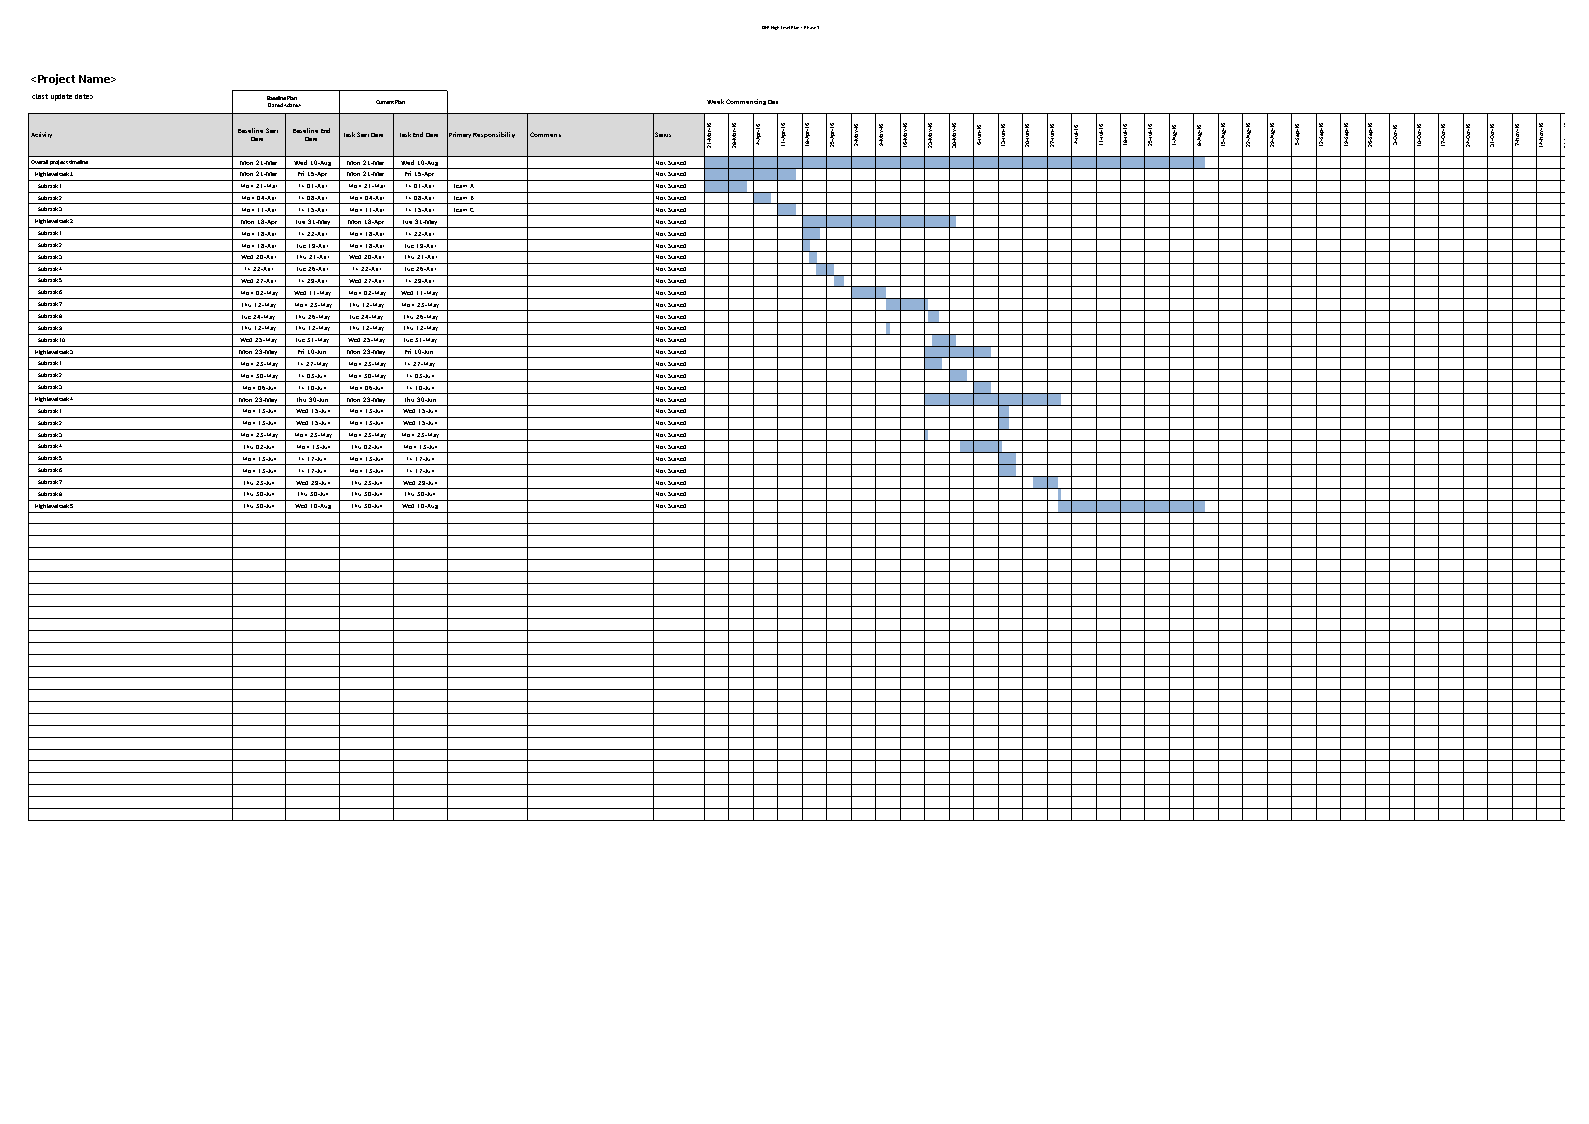
Do you need a template for a Gantt Chart for Project Management? What are the steps involved in creating an Excel Gantt chart for project management? Our sample template is a great way to visualize project timelines and prioritize tasks. It is also useful for tracking progress and identifying areas that need improvement. Download this template now which you can easily create a comprehensive project management Gantt chart.
A Project Management Gantt Chart in Excel is a visual representation of a project schedule that uses the Gantt Chart format within Microsoft Excel. Gantt Charts are widely used in project management to illustrate the timeline of tasks, their dependencies, start and end dates, and overall project progress.
Here's how you can create a Project Management Gantt Chart in Excel:
- Data Setup:
- Organize your project data in a table with columns such as Task Name, Start Date, Duration, and any additional relevant information.
- Insert a Stacked Bar Chart:
- Select your data table and go to the "Insert" tab on the Excel ribbon.
- Choose "Bar Chart" and select "Stacked Bar."
- Adjust Chart Data:
- Right-click on the chart, choose "Select Data," and add a new series. Select your "Start Date" column for the new series.
- Now, you should have two series: one for the task duration and another for the task start date.
- Format Dates:
- Right-click on the horizontal axis, choose "Format Axis," and set the minimum and maximum bounds to match your project start and end dates.
- Format Bars:
- Format the task duration bars by adjusting the color, width, and other properties. You may also add labels or data labels for clarity.
- Add Milestones and Dependencies:
- You can add milestones as additional data series or use symbols, shapes, or labels on the chart to represent key project events.
- To show dependencies, use arrows or connectors to link related tasks on the Gantt Chart.
- Customization:
- Customize the chart by adding titles, labels, and legends to make it more informative.
- Adjust the chart layout and design to enhance readability.
- Update and Maintain:
- As your project progresses, update the Gantt Chart by adjusting task durations, start dates, and completion statuses.
Using Excel for Gantt Charts is a cost-effective solution for smaller projects or when more advanced project management tools are not available. However, for larger and more complex projects, dedicated project management software might be more efficient in terms of collaboration, real-time updates, and additional project management features.
Feel free to download this, or simply browse through our other basic or advanced template designs. They are intuitive and in several kinds of formats, such as PDF, WORD, XLS (EXCEL including formulas and can calculate sums automatically), etc.
Using this project management template guarantees that you will save time, cost, and effort and makes you more successful in your project, work, and business!
Completing your project management was never simpler! Download it now!
DISCLAIMER
Nothing on this site shall be considered legal advice and no attorney-client relationship is established.
发表评论。 如果您有任何问题或意见,请随时在下面发布
相关文件
Sponsored Link


