Comparative Financial Statement Analysis
Sponsored Link免费模板 保存,填空,打印,三步搞定!

Download Comparative Financial Statement Analysis
微软的词 (.doc)免费文件转换
- 本文档已通过专业认证
- 100%可定制
- 这是一个数字下载 (476.5 kB)
- 语: English
Sponsored Link
How to create a Comparative Financial Statement Analysis? An easy way to start completing your document is to download this example Comparative Financial Statement Analysis template now!
We provide this Comparative Financial Statement Analysis template to help professionalize the way you are working. Our business and legal templates are regularly screened and used by professionals. If time or quality is of the essence, this ready-made template can help you to save time and to focus on the topics that really matter!
Using this Comparative Financial Statement Analysis template guarantees you will save time, cost and efforts! Completing documents has never been easier!
Download this Comparative Financial Statement Analysis template now for your own benefit!
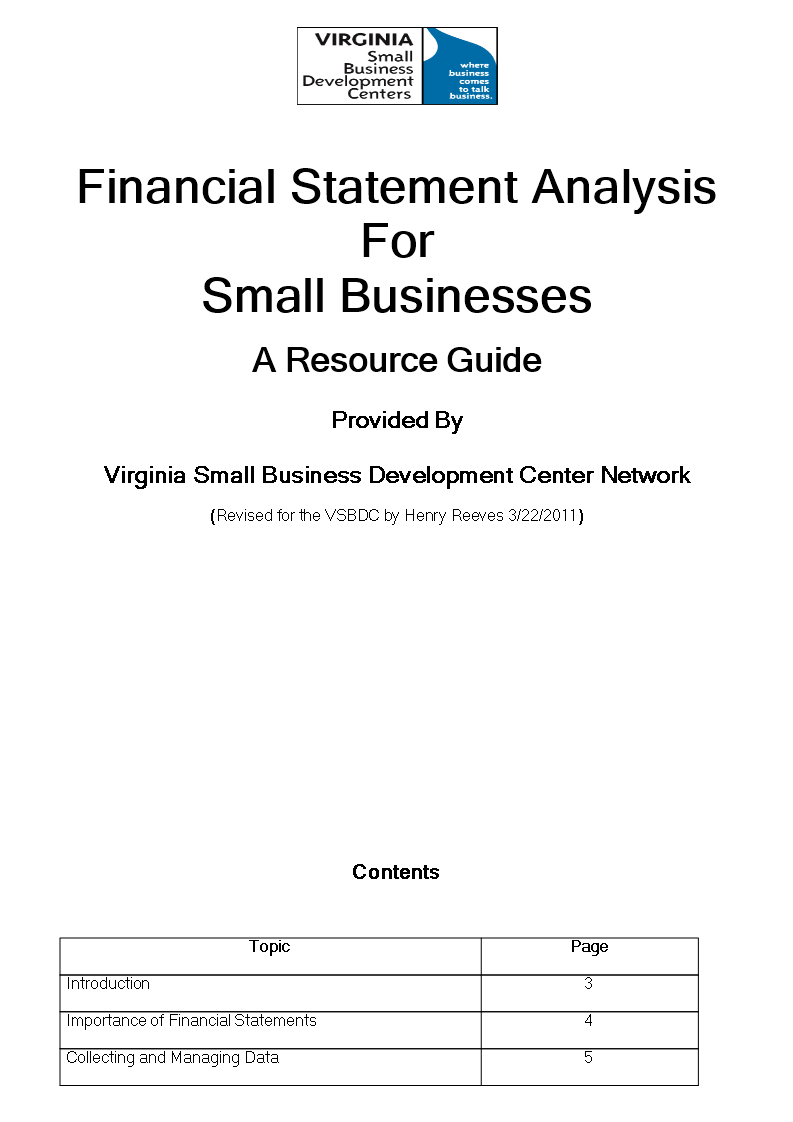
Financial Statement Analysis For Small Businesses A Resource Guide Provided By Virginia Small Business Development Center Network (Revised for the VSBDC by Henry Reeves 3/22/2011) Contents Topic Page Introduction 3 Importance of Financial Statements 4 Collecting and Managing Data 5 The Income Statement 7 The Balance Sheet 9 Reconciliation of Equity or Statement of Changes in Stockholder Equity 12 Statement of Cash Flows 12 Notes to Financial Statements 13 Financial Ratios Explanation 13 Key Terms and Concepts 20 Financial Statements as a Management Tool 24 Three Case Studies 32 Figure 1: Summary Table of Financial Ratios 36 Figure 2: K-L Fashions, Inc.. Financial Statements Income Statement For the year ended January 31: (Dollars in thousands) 2005 2004 2003 2002 Net Sales 6,039,750 5,452,010 4,558,060 3,362,910 Cost of Goods 3,573,070 3,135,730 2,616,710 1,903,480 Gross Profit 2,466,680 2,316,280 1,941,350 1,459,430 Selling, General and Administrative Expenses (including depreciation) 2,221,540 1,849,100 1,434,860 1,076,990 Income from Operations 245,140 467,180 506,490 382,440 Other Income (expenses): Interest and other income 14,470 19,510 27,250 14,410 Interest Expense (10,180) (13,990) (12,320) (13,570) Income Before Income Taxes 249,430 472,700 521,420 383,280 Income Tax Provision 102,000 181,990 198,600 162,080 Net Income 147,430 290,710 322,820 221,200 (As a Percentage of Sales) Net Sales 100.0 100.0 100.0 100.0 Cost of Goods 59.2 57.5 57.4 56.6 Gross Profit 40.8 42.5 42.6 43.4 Selling, General and Administrative Expenses (including depreciation) 36.8 33.9 31.5 32.0 Income from Operations 4.0 8.6 11.1 11.4 Other Income (expenses): Interest and other income .3 .4 .6 .4 Interest Expense (.2) (.3) (.3) (.4) Income Before Income Taxes 4.1 8.7 11.4 11.4 Income Tax Provision 1.7 3.4 4.3 4.8 Net Income 2.4 5.3 7.1 6.6 Figure 2.. Financial Statements Balance Sheet January 31: (Dollars in thousands) 2005 2004 2003 2002 Assets Current Assets: Cash an
DISCLAIMER
Nothing on this site shall be considered legal advice and no attorney-client relationship is established.
发表评论。 如果您有任何问题或意见,请随时在下面发布
相关文件
Sponsored Link

